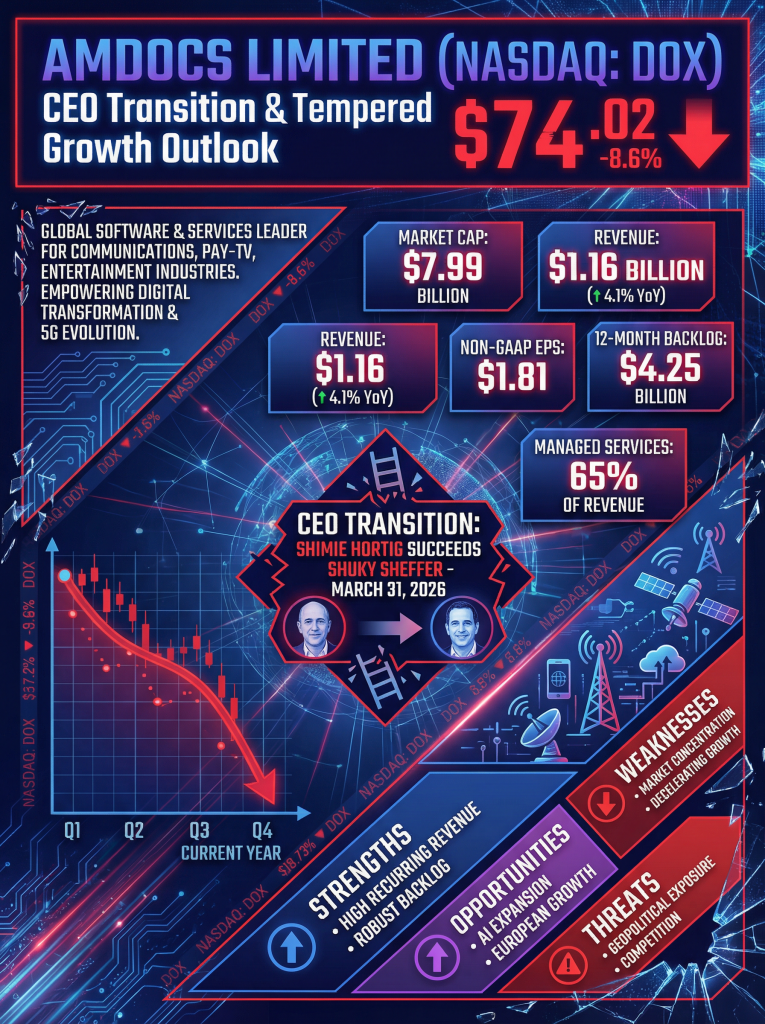
Shares of Amdocs Limited (NASDAQ: DOX) traded at $74.02 on Wednesday, down 8.6% following its fiscal first-quarter earnings release and the announcement of a leadership transition.
Company Description
Amdocs Limited (NASDAQ: DOX) provides software and services to the communications, pay-TV, entertainment, and media industries. The company specializes in cloud-native business and operational support systems (BSS/OSS), digital experience platforms, and managed services. Its primary end markets include global telecommunications providers across North America, Europe, and emerging markets.
Market Performance and Valuation
- Current Stock Price: $74.02 (as of mid-day Feb 4, 2026)
- Market Capitalization: Approximately $7.99 billion
- 52-Week Context: The stock is currently trading near its 52-week low of $73.18, down from its 52-week high of $95.41.
- Valuation: Amdocs carries a trailing price-to-earnings (P/E) ratio of 14.66. Its forward P/E is estimated at 9.83, reflecting a conservative valuation relative to the broader IT services sector as investors weigh a moderated growth outlook.
First Quarter Fiscal 2026 Results
Amdocs reported results for the quarter ended December 31, 2025:
- Revenue: $1.16 billion, up 4.1% year-over-year (3.5% in constant currency).
- Non-GAAP Diluted EPS: $1.81, surpassing the guidance range of $1.73–$1.79.
- 12-Month Backlog: Increased to $4.25 billion, up 2.7% from the previous year.
- Managed Services: Revenue reached $746 million, representing approximately 65% of total revenue.
- Shareholder Returns: The company repurchased $146 million in shares and increased its quarterly dividend to $0.569 per share.
Full-Year 2026 Guidance and Forecasts
The company updated its fiscal year 2026 outlook:
- Annual Revenue Growth: Projected at 1.5% to 5.5% as reported (1.0% to 5.0% in constant currency).
- Non-GAAP Diluted EPS: Expected growth of 4.0% to 8.0% year-over-year.
- GAAP Diluted EPS: Guidance growth was adjusted to 10.0% to 17.0%, compared to the previous range of 13.5% to 20.5%.
- Free Cash Flow: Maintained at $710 million to $730 million.
Macro Pressures and Geopolitical Risk
Amdocs faces ongoing macro-economic headwinds, including industry-wide pressure on telecom spending.
- Geopolitical Risk: The company maintains significant operations in Israel, exposing it to regional volatility and operational uncertainty.
- Management Change: The board announced that Shimie Hortig will succeed Shuky Sheffer as President and CEO effective March 31, 2026. This transition, combined with the tempered growth outlook, contributed to the sharp intraday decline.
SWOT Analysis
| Strengths | Weaknesses |
| High percentage of recurring revenue (65% Managed Services). | Heavy concentration in North American market (66% of revenue). |
| Robust 12-month backlog of $4.25B provides revenue visibility. | Decelerating growth rates in constant currency. |
| Opportunities | Threats |
| Expansion into Generative AI and 5G network monetization. | High geopolitical exposure due to significant Israeli operations. |
| Strong growth in European markets (up 17.1% YoY). | Intense competition from cloud-native software incumbents. |