Best Buy Co. Inc. (NYSE: BBY) has released its fourth-quarter 2026 earnings, displaying a notable divergence between top-line revenue trends and bottom-line profitability. The financial data, evaluated on a year-over-year basis, highlights significant net earnings momentum despite a modest contraction in overall sales figures.
Key Financial Metrics
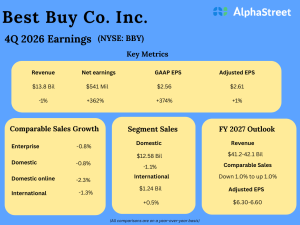
For the 4Q 2026 period, Best Buy reported a total revenue of $13.8 billion, which represents a 1% decline compared to the same period last year. However, the company experienced a dramatic improvement in its profitability. Net earnings stood at $541 million, reflecting an exceptional 362% year-over-year surge. This massive growth in net earnings directly translated to the company’s GAAP Earnings Per Share (EPS), which climbed 374% to $2.56. Meanwhile, the Adjusted EPS demonstrated a much more stable trajectory, posting a minor 1% increase to settle at $2.61.
Segment and Comparable Sales Performance
An analysis of segment sales reveals varying performance across operational regions. The Domestic segment, the core driver of the business, generated $12.58 billion in sales, indicating a 1.1% decrease. In contrast, the International segment provided a slight positive offset, with sales growing by 0.5% to reach $1.24 billion.
Comparable sales metrics indicate slight headwinds across most retail channels. Enterprise comparable sales growth contracted by 0.8%. This was matched by a 0.8% decline in Domestic comparable sales. Notably, the Domestic online channel experienced the steepest drop among the listed categories, falling by 2.3%. International comparable sales also saw a contraction, decreasing by 1.3%.
FY 2027 Financial Outlook
Best Buy’s management has also outlined its expectations for the fiscal year 2027. The outlook projects total revenue to fall within the range of $41.2 billion to $42.1 billion. The company anticipates comparable sales to remain relatively flat, forecasting a range from down 1.0% to up 1.0%. Additionally, the target for Adjusted EPS is set between $6.30 and $6.60 for the year.