Rev YoY +6.3%|Net Margin -4.7%
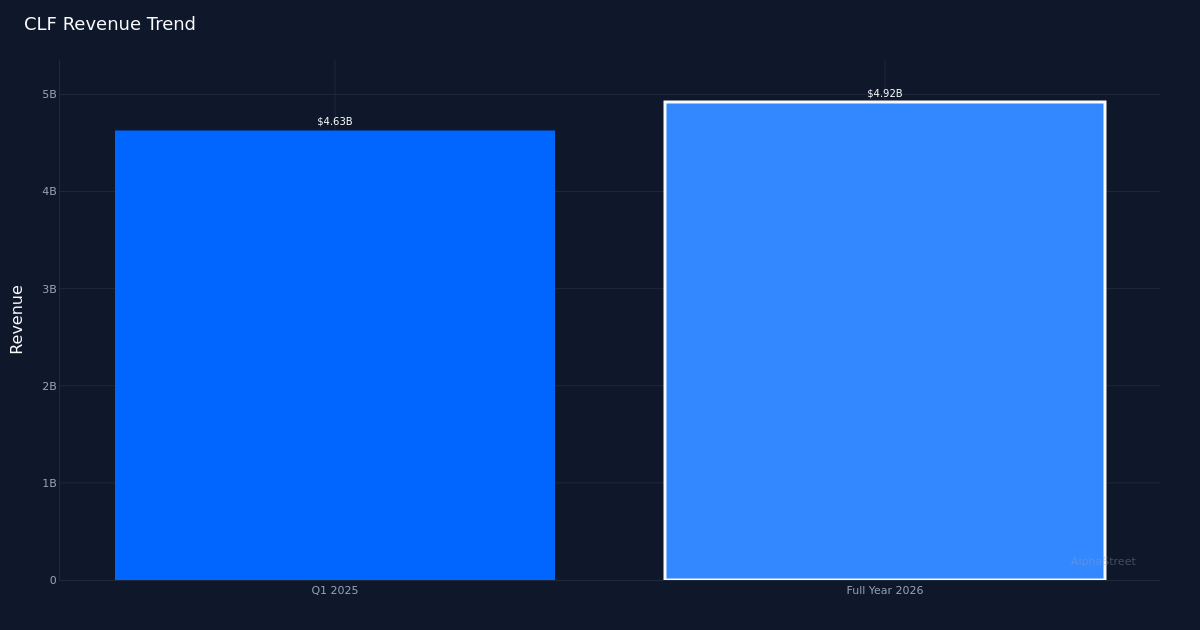
Cleveland-Cliffs Inc. (NYSE: CLF) delivered a materially narrower loss in Q1 2026, posting an adjusted loss per share of $0.40, versus a loss of $1.01 in the year-ago quarter, reflecting pricing momentum and volume recovery. The steel producer generated revenue of $4.92B, up 6.3% year-over-year, while net loss narrowed to $229.0M from $486.0M a year earlier. The sequential and year-over-year trajectory reveals a cyclical bottom forming, with pricing power returning to the steel market after an extended downturn. EBITDA of $95.0M represented a stark reversal from deeply negative territory, though the absolute level remains modest relative to the company’s revenue base.
The quality of this quarter’s improvement hinges on pricing expansion rather than operational efficiency gains. Net margin improved by 5.8 percentage points year-over-year to negative 4.7% from negative 10.5%, reflecting the narrowing loss structure. However, the company remains in negative margin territory despite revenue growth, signaling that cost structure still exceeds pricing realization on a fully-loaded basis. Management highlighted that “average selling prices increased by $68 per ton from a year ago and sequentially by $55 per ton during the quarter, reflecting improving market conditions and better automotive pull.” This pricing momentum drove the EBITDA improvement. The margin trajectory suggests the company is climbing out of a trough, but profitability remains contingent on sustained pricing discipline rather than structural cost advantages.
Revenue trajectory analysis reveals stabilization after what appears to have been a multi-quarter downturn. The four-quarter trend shows revenue of $4.63B in Q1 2025, followed by the current quarter’s $4.92B. The 6.3% year-over-year growth rate marks a return to positive territory. Volume recovery played a key role, with management noting that “first quarter shipments totaled just over 4.1 million tons, which represents a recovery of 338,000 tons sequentially.” Steel shipments of 4.1 million net tons indicate the company is operating at substantial scale, and the sequential volume improvement represents meaningful throughput recovery.
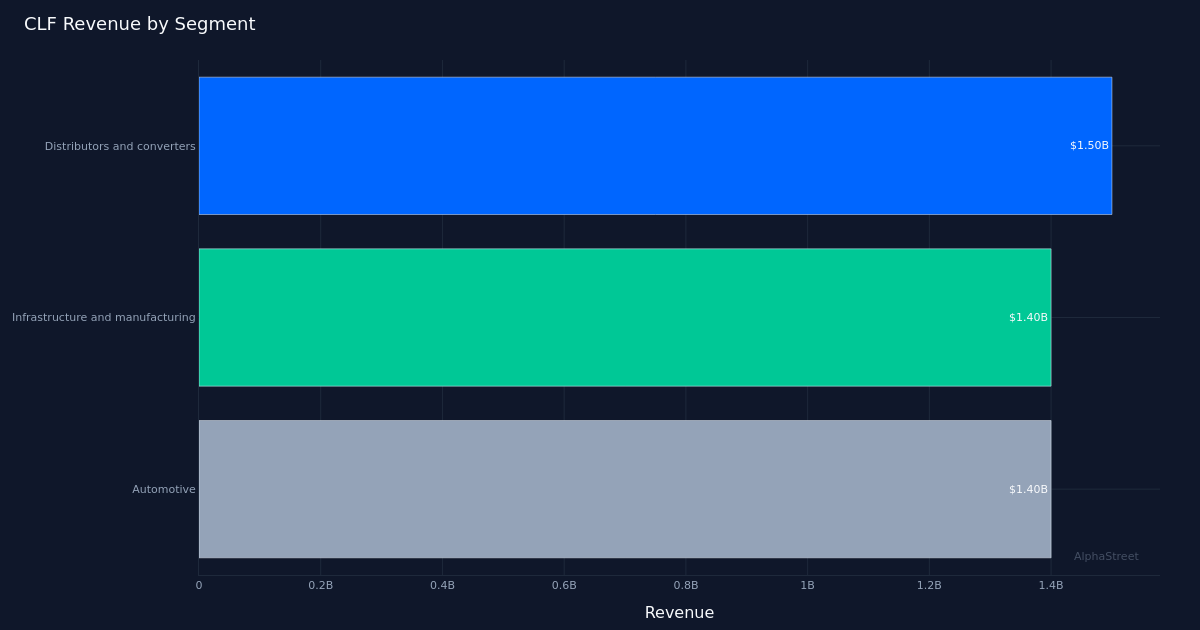
Segment composition reveals balanced demand across Cleveland-Cliffs’ three primary end markets, though no single segment is demonstrating breakout strength. The distributors and converters segment generated $1.50B, representing the largest revenue contributor, while infrastructure and manufacturing contributed $1.40B, and automotive also delivered $1.40B. The near-parity between infrastructure/manufacturing and automotive segments—both at exactly $1.40B—suggests broad-based demand rather than concentration risk in any single vertical. The automotive segment’s performance is particularly notable given the cyclical headwinds facing that industry, with management attributing pricing gains partially to “better automotive pull.” The distributor segment’s leading position reflects the importance of service center inventory restocking in the current phase of the steel cycle.
Working capital dynamics point to a business inflecting toward growth rather than managing decline. Management disclosed that “the Q1 build of working capital, about $130 million, was primarily driven by AR as pricing continued to rise in March, shipments were strong, and it was offset by a reduction in inventory.” This accounts receivable build typically signals accelerating sales activity and rising prices—customers are buying more at higher prices, creating timing lags in cash collection. The simultaneous inventory reduction suggests the company is successfully converting raw material and work-in-process into finished goods and shipments, a positive operational indicator. This working capital pattern contrasts sharply with distressed scenarios where inventory builds while receivables stagnate.
Management’s forward commentary suggests substantial EBITDA leverage to further pricing improvement. The company’s executive team noted that “last quarter we were talking about, I think about a $500 million increase in EBITDA.” While the current quarter delivered EBITDA of $95.0M, this commentary implies that steel pricing at specific levels could drive EBITDA to approximately $595 million in a more normalized environment. This leverage profile reflects the high fixed-cost nature of integrated steel production, where incremental pricing flows directly to EBITDA once variable costs are covered. The $68 per ton year-over-year pricing gain has already driven a $274 million EBITDA improvement, establishing a clear sensitivity ratio that investors can model for future quarters.
The stock’s modest 2.3% gain to $9.94 suggests the market is treating this as confirmation of a gradual recovery rather than an inflection point. The muted reaction likely reflects continued skepticism about the sustainability of steel pricing improvements and the company’s ability to return to consistent profitability. At the current price level, the market appears to be pricing in modest improvement from trough conditions but not rewarding the company for the sequential momentum evident in volumes and pricing. The loss per share of $0.40, while improved from $0.93 a year ago, keeps the company firmly in negative earnings territory, limiting upside catalysts until profitability is restored on a GAAP basis.
This article was generated with the assistance of AI technology and reviewed for accuracy. AlphaStreet may receive compensation from companies mentioned in this article. This content is for informational purposes only and should not be considered investment advice.