
CorVel Corporation (NASDAQ: CRVL) provides technology-enabled services for claims management, medical cost containment, and analytics-driven workflows. The company operates across its Property & Casualty and CERIS platforms.
Financial Performance
For the quarter ended December 31, 2025, CorVel reported revenue of $235.6 million, compared with $228.0 million in the same quarter of the prior year. Gross profit increased to $54.9 million from $52.9 million a year earlier. Net income for the quarter was $24.2 million, compared with $23.8 million in the prior-year period. Diluted earnings per share increased to $0.47 from $0.46.
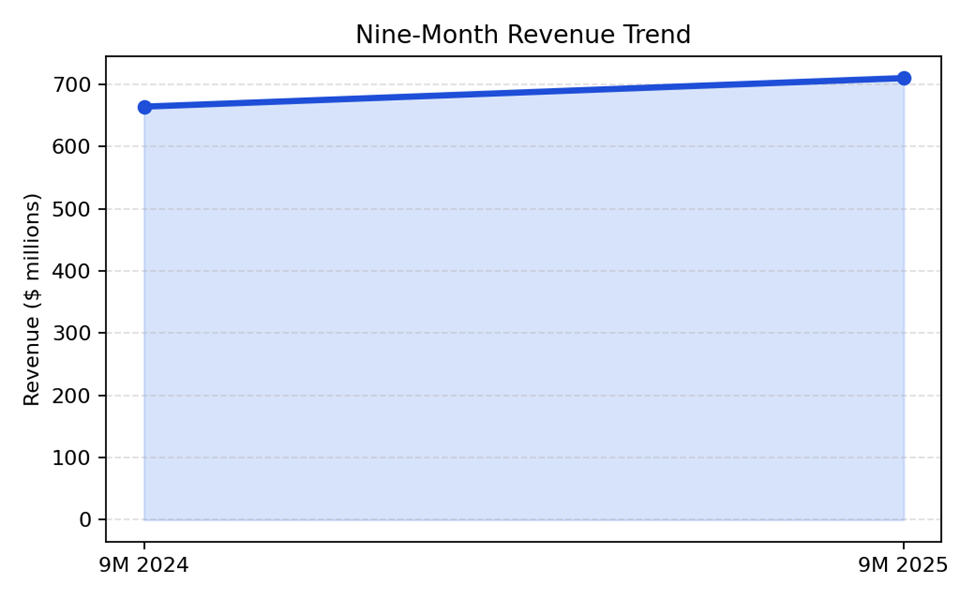
For the nine months ended December 31, 2025, revenue totaled $710.0 million, up from $664.1 million in the corresponding period a year earlier. Net income for the nine-month period was $79.3 million, compared with $68.7 million in the prior-year period.
Operating Metrics
The charts below present operating metrics. Metrics shown include quarterly revenue, gross profit with earnings per share trend, and nine-month revenue.
Chart 1 — Quarterly Revenue Comparison
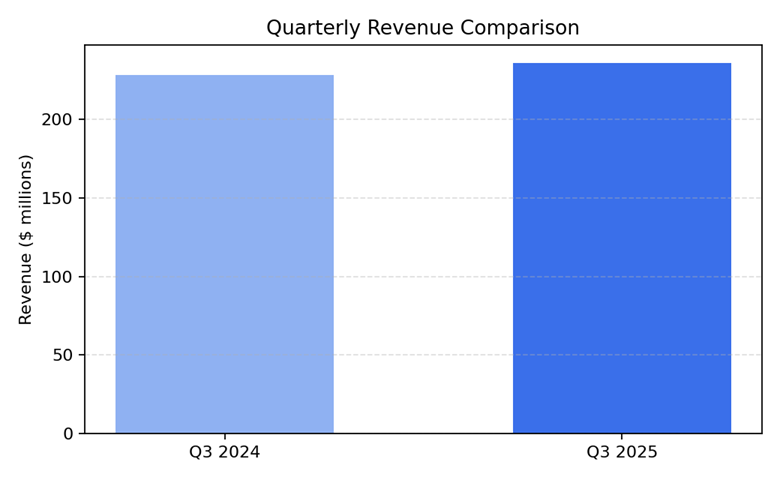
Chart 2 — Gross Profit and EPS Trend
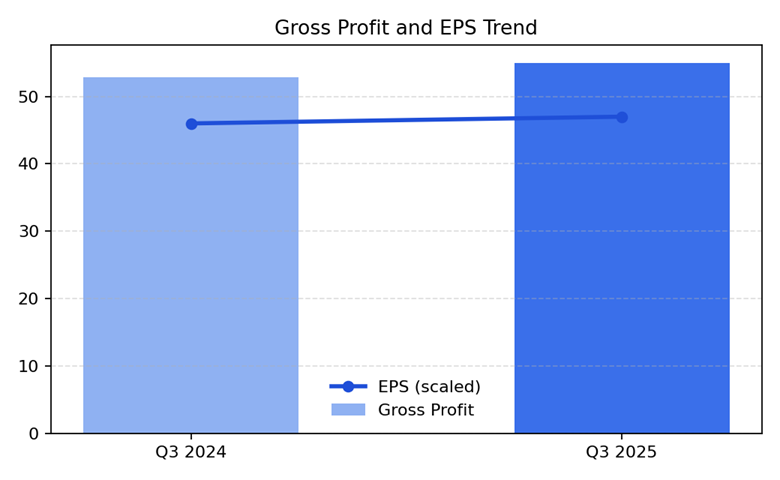
Chart 3 — Nine-Month Revenue Trend
Key Developments
During the quarter, CorVel exited the period with $230.0 million in cash and cash equivalents and no borrowings. The company repurchased $13.4 million of common stock during the quarter. Management reported continued progress in advancing automation and artificial intelligence initiatives.
Risks and Constraints
The company operates in a regulated environment and is exposed to risks related to regulatory change, medical cost trends, competitive pressures, and execution of technology initiatives.
Outlook / Guidance
The company did not provide long-term quantitative guidance. What to watch for includes revenue trends, operating margin movement, progress on technology initiatives, and capital allocation activity.
Performance Summary
CorVel reported year-over-year increases in revenue, gross profit, and earnings per share for the December quarter. Nine-month revenue also increased compared with the prior-year period.