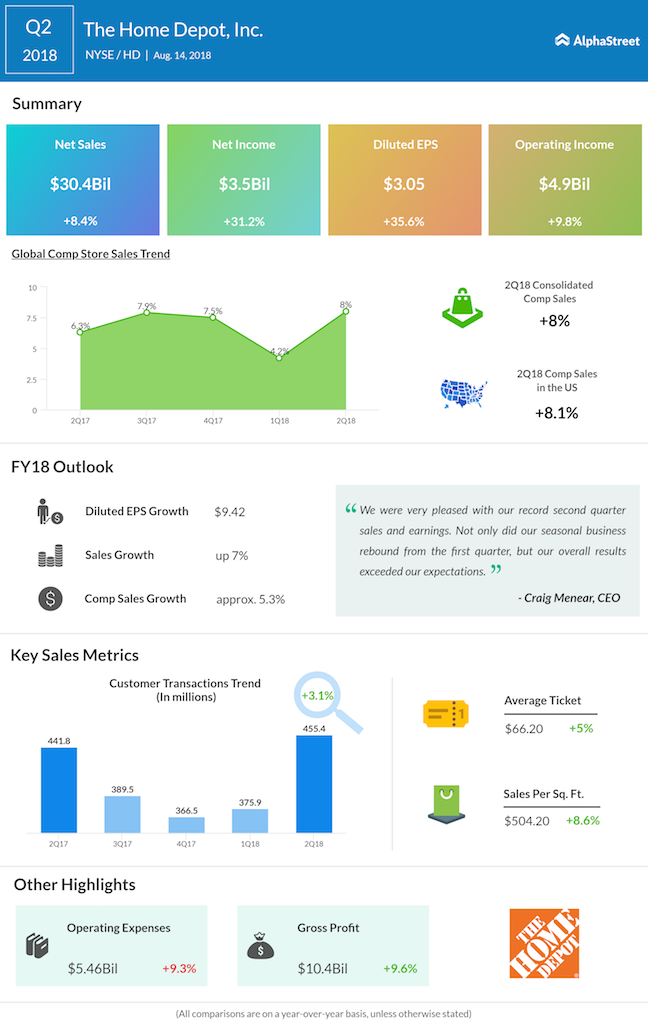
The Home Depot Inc. (HD) beat market estimates on both revenues and earnings for the second quarter of 2018. The home improvement retailer reported sales of $30.5 billion, up 8.4% from the same period last year. Comparable sales were up 8% while comparable sales in the US were up 8.1%.
Net income was $3.5 billion or $3.05 per diluted share compared to $2.7 billion or $2.25 per diluted share in the prior-year period, reflecting a growth of 35.6% in diluted EPS.
Home Depot updated its guidance for the full year of 2018. The company now expects sales to increase around 7% including the 53rd week, and comp sales to grow around 5.3% for the comparable 52-week period. Home Depot also anticipates diluted EPS to grow approx. 29.2% from fiscal year 2017 to $9.42.

At the end of Q2 2018, Home Depot operated a total of 2,286 retail stores in all 50 states, the District of Columbia, Puerto Rico, US Virgin Islands, Guam, 10 Canadian provinces and Mexico.
During Q2, customer transactions increased 3.1% while average ticket saw a growth of 5%. Sales per square foot improved 8.6%. The strength in sales was driven by good weather conditions along with favorable trends in both the housing market and the general economic environment.
Shares rose over 2% in premarket trading following the results announcement.
Related: Home Depot Q2 2018 Earnings Transcript
Related: Home Depot Earnings Preview
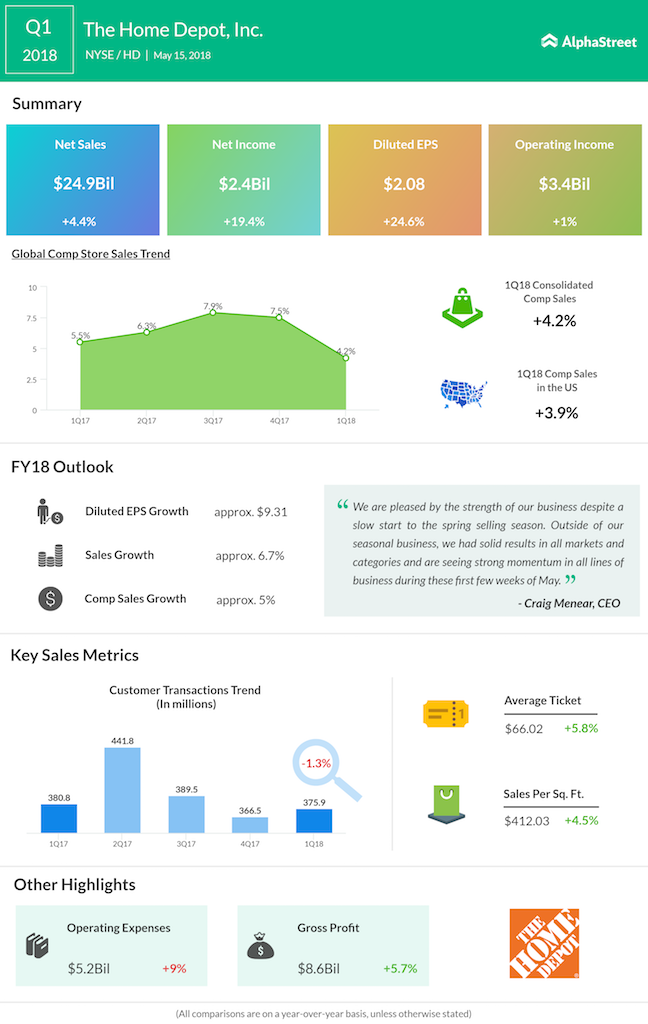
Related: Home Depot Q1 2018 Earnings Infographic