Categories AlphaGraphs, Earnings, Finance

Infographic: Key highlights from Citigroup (C) Q2 2021 earnings results

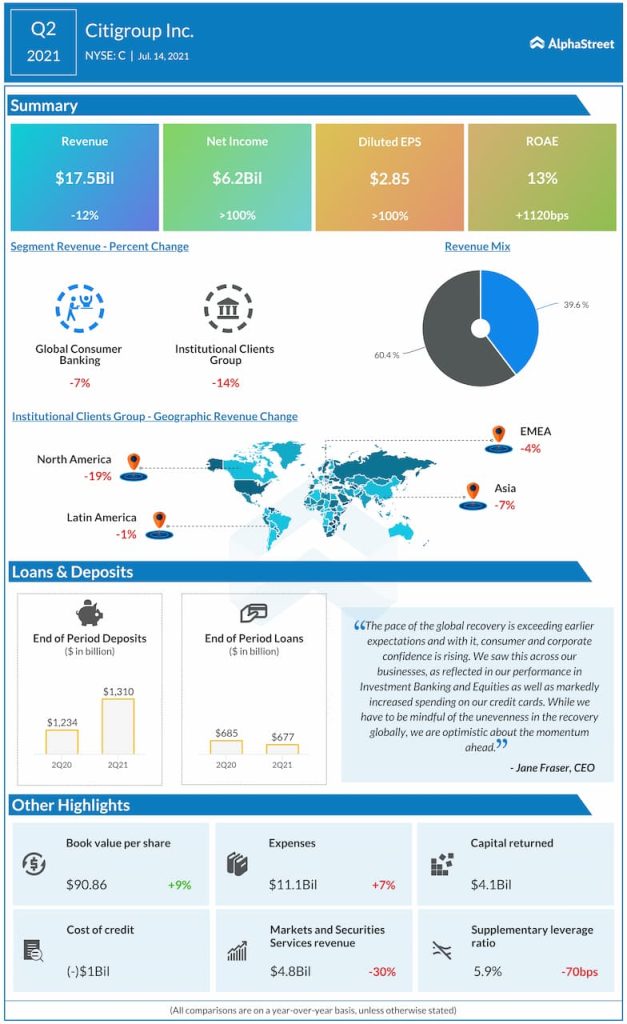
Citigroup Inc. (NYSE: C) reported second quarter 2021 earnings results today.

Total revenues dropped 12% year-over-year to $17.5 billion, driven by market normalization in Fixed Income Markets and lower average card loans in Global Consumer Banking.   

Net income was $6.2 billion, or $2.85 per share, compared to $1.1 billion, or $0.38 per share, in the prior-year period. The growth in net income was driven by lower cost of credit.

End-of-period deposits were $1.3 trillion, up 6% on a reported basis and 4% in constant dollars.

Prior performance

Looking for more insights on the earnings results? Click here to access the full transcripts of the latest earnings conference calls!

Most Popular

Earnings Preview: What to look for when Netflix (NFLX) reports Q4 2025 results

Netflix, Inc. (NASDAQ: NFLX) is expected to report Q4 results on January 20, amid expectations for strong revenue and earnings growth. The company is navigating a shifting streaming landscape where

What to look for when United Airlines (UAL) reports its Q4 2025 earnings results

Shares of United Airlines (NASDAQ: UAL) stayed red on Thursday. The stock has gained 15% over the past three months. The airline is scheduled to report its earnings results for

Infographic: How Constellation Brands (STZ) performed in Q3 2026

Constellation Brands, Inc. (NYSE: STZ) reported net sales of $2.22 billion for the third quarter of 2026, down 10% year-over-year. Organic net sales were down 2%. Net income attributable to

Add Comment
Loading...
Cancel
Viewing Highlight
Loading...
Highlight
Close
Top