AlphaStreet Newsdesk powered by AlphaStreet Intelligence
Wall Street Consensus. Quaker Chemical Corporation reports first quarter 2026 results on May 1st, with analysts expecting earnings of $1.62 per share on revenue of $465.1M. The consensus view represents a tight range among the five analysts covering the specialty chemicals company, with EPS estimates spanning $1.57 to $1.72 and revenue projections ranging from $456.2M to $471.3M.
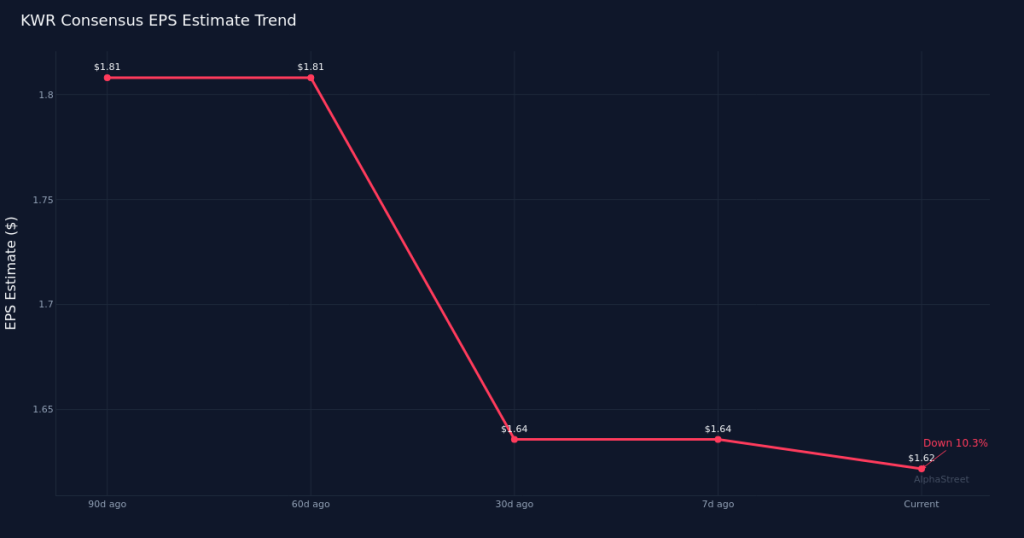
Downward Revisions Signal Caution. Analyst estimates have trended lower in recent months, with the consensus EPS call declining 1.2% over the past thirty days from $1.64. More notable is the 90-day trajectory, which shows estimates down 10.5% from $1.81 three months ago. This steady erosion in expectations suggests analysts have been recalibrating their models downward, potentially reflecting concerns about demand conditions, input cost pressures, or customer destocking patterns that have persisted longer than initially anticipated in the specialty chemicals sector.
Modest Growth From Year-Ago Levels. The Street’s revenue estimate of $465.1M implies growth of 5.0% compared to the $442.9M reported in the first quarter of 2025. On the bottom line, the $1.62 consensus EPS represents a 2.5% increase over year-ago earnings of $1.58 per share. This revenue-to-earnings growth differential is worth noting: the top line is expected to expand at double the rate of per-share earnings, suggesting margin compression or a higher share count may be constraining profitability leverage. Last year’s first quarter delivered net income of $28.0M on a net margin of 6.3%, providing a baseline for evaluating whether Quaker can maintain or expand profitability as it scales revenue.
Profitability Context. The year-ago net margin of 6.3% establishes an important reference point for assessing operational execution this quarter. Specialty chemicals companies often face tension between volume growth and margin preservation, particularly when raw material costs fluctuate or when competitive dynamics force pricing discipline. Whether Quaker can hold or expand margins while delivering the expected revenue growth will be a key investor focus, especially given the deceleration in EPS growth expectations relative to revenue.
Stock Price Positioning. Quaker shares currently trade at $140.65 heading into the report. The stock’s position relative to its recent trading range will influence how investors interpret the results, as will the magnitude of any guidance adjustments management provides for the remainder of 2026. With estimates drifting lower over the past quarter, the bar has been reset, but the market will be scrutinizing whether the downward revisions have fully captured the operating environment or if further adjustments lie ahead.
Analyst Coverage Landscape. Coverage from five analysts provides a reasonably diverse set of perspectives, though the estimate range suggests general alignment on the near-term outlook. The relatively narrow spread on both EPS and revenue forecasts indicates limited disagreement about quarterly performance drivers, which could amplify stock volatility if results deviate meaningfully from consensus in either direction.
Growth Deceleration Narrative. The implied 2.5% year-over-year EPS growth stands in stark contrast to the double-digit downward estimate revisions over the past ninety days. This disconnect highlights how much more optimistic the Street was just three months ago about Quaker’s earnings power. Understanding what changed—whether end-market demand, customer inventory management, competitive pricing, or cost inflation—will be critical to assessing whether current expectations are appropriately calibrated or if further reset is needed.
This content is for informational purposes only and should not be considered investment advice. AlphaStreet Intelligence analyzes financial data using AI to deliver fast and accurate market information. Human editors verify content.