
Business Overview
Selective Insurance Group, Inc. (NASDAQ: SIGI) is a U.S.-based property and casualty insurer operating through its insurance subsidiaries. The company provides commercial, personal, and excess and surplus insurance products primarily to small and mid-sized businesses and individuals. Its operations are organized into Standard Commercial Lines, Standard Personal Lines, and Excess and Surplus Lines. The company distributes its products through independent agents and brokers and focuses on disciplined underwriting, pricing actions, and risk selection.
Financial Performance
For the fourth quarter ended December 31, 2025, Selective reported consolidated total revenues of $1,364.9 million, compared with $1,252.1 million in the same quarter a year earlier. Net income available to common stockholders for the quarter was $152.9 million, up from $93.4 million in Q4 2024. Diluted earnings per share were reported at $2.52. For the full year 2025, total revenues increased to $5,336.9 million from $4,861.7 million in 2024, while net income rose to $457.2 million from $197.8 million in the prior year. The full-year combined ratio improved to 97.2% from 103.0% in 2024.
Operating Metrics
Key operating metrics for Selective Insurance Group are presented below.
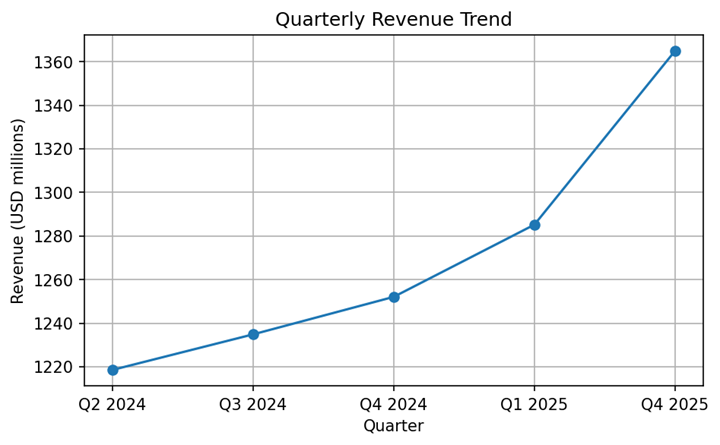
Chart 1: Quarterly revenue trend (USD millions).
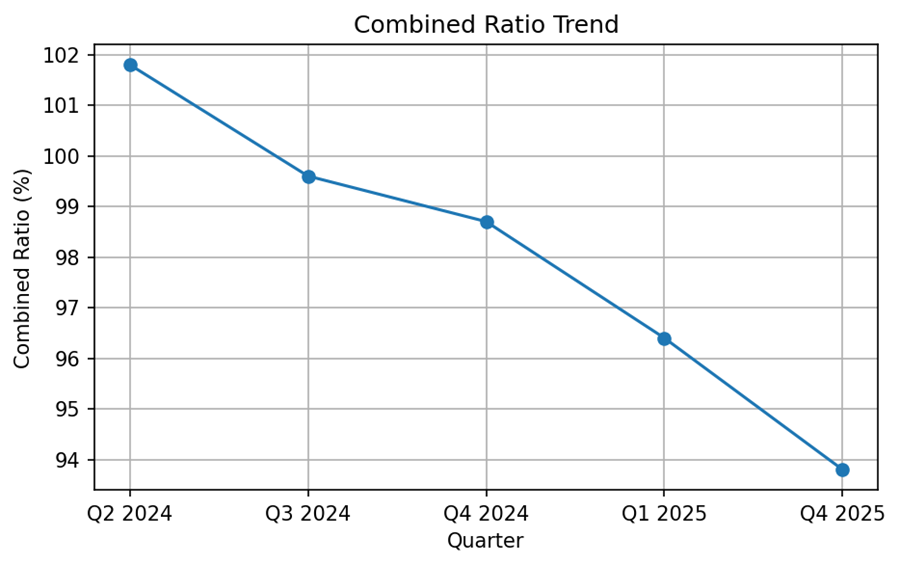
Chart 2: Combined ratio trend (%).
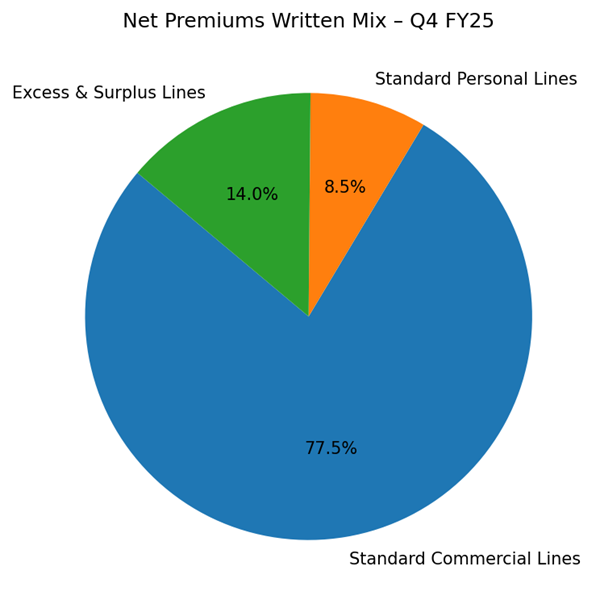
Chart 3: Net premiums written mix for Q4 FY25.
Key Developments
During the quarter, the company continued to implement underwriting and pricing actions across its portfolio. Average renewal pure price increases were reported at 8.3% for the quarter and 9.5% for the full year. Net premiums written in Standard Commercial Lines totaled $875.6 million in Q4 FY25, while Excess and Surplus Lines reported net premiums written of $158.4 million. Standard Personal Lines net premiums written declined to $95.5 million. After-tax net investment income increased to $114.2 million for the quarter and $421.2 million for the full year.
Risks and Constraints
The company remains exposed to industry-wide risks, including catastrophe losses, claims severity trends, and changes in reinsurance pricing. Regulatory requirements and rate approval processes may also affect pricing actions. Investment income performance remains sensitive to interest rate movements and broader capital market conditions.
Outlook / Guidance
Selective outlined several guideposts for 2026, including a GAAP combined ratio range of 96.5% to 97.5% and an assumption of approximately six points of catastrophe losses. The company also indicated an after-tax net investment income target of around $465 million, an effective tax rate of approximately 21.5%, and a weighted average of diluted shares outstanding of about 61 million.
Performance Summary
The company reported higher quarterly and annual revenues in Q4 FY25. Net income increased year over year, and underwriting metrics improved. Standard Commercial Lines remained the largest contributor to premiums written. Operating and investment income trends showed improvement compared with 2024.