Business Overview
American Express Company (NYSE: AXP) operates as a global payments and travel services firm. The company issues charge and credit cards and provides payment processing, network services, and card member benefits. Operations are organized across U.S. consumer, global commercial, merchant services, and international businesses. Products are distributed through direct channels, partner relationships and third‑party distributors.
Financial Performance
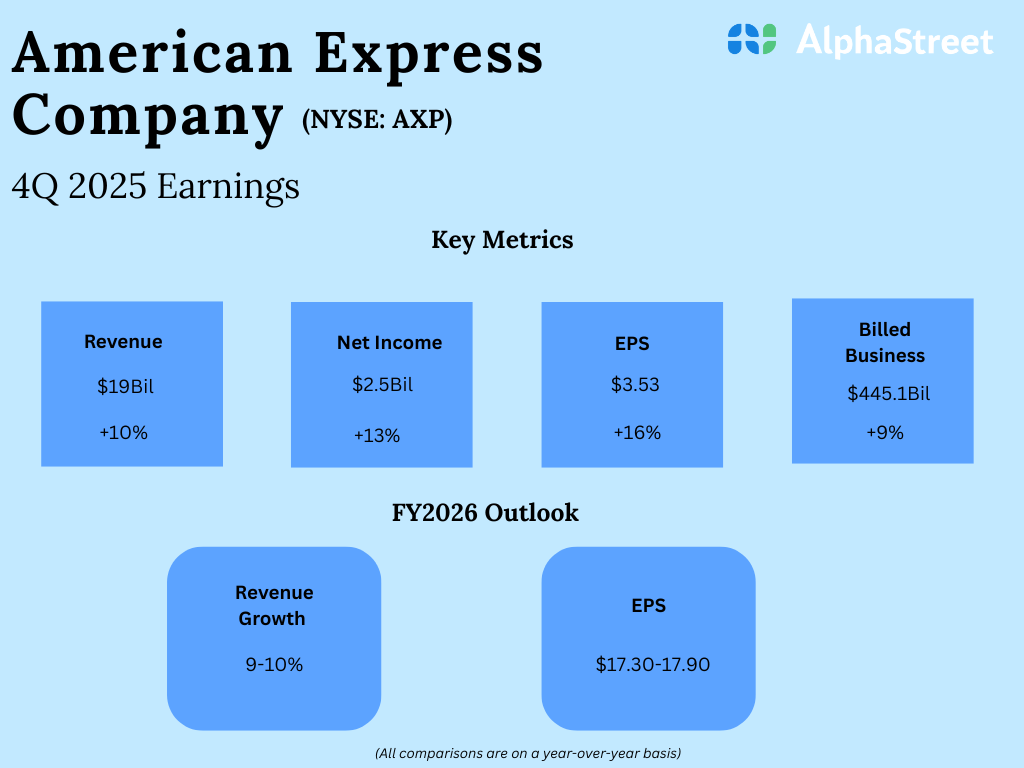
For the quarter ended December 31, 2025, American Express reported total revenues, net of interest expense, of $18,980 million. Net income for the quarter was $2,462 million, and diluted earnings per share were $3.53. For the full year 2025, total revenues were $72,229 million, compared with $65,900 million in 2024. Full‑year net income was $10,833 million, up from $9,300 million a year earlier. Quarterly revenue rose about 10% year over year. Full-year revenue increased about 10% year over year.
Operating Metrics
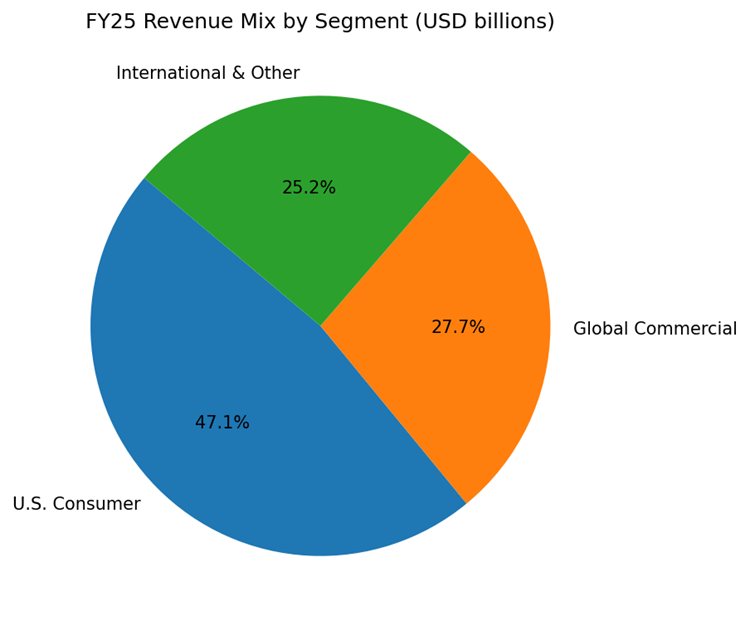
Key operating metrics include annual revenue and net income trends and the FY25 revenue mix across business segments. Charts below show revenues and net income for fiscal years 2022 through 2025 and the FY25 segment composition.
Chart 1: Revenues (FY22 – FY25).
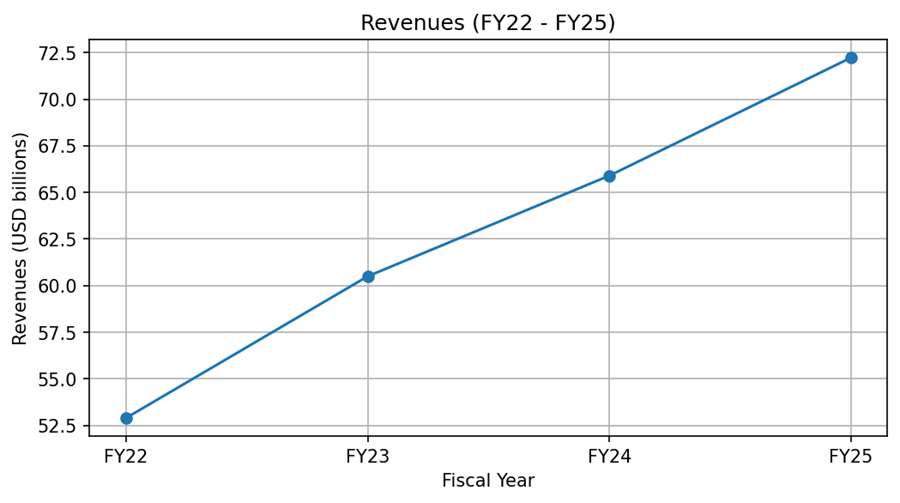
Chart 2: Net Income (FY22 – FY25).
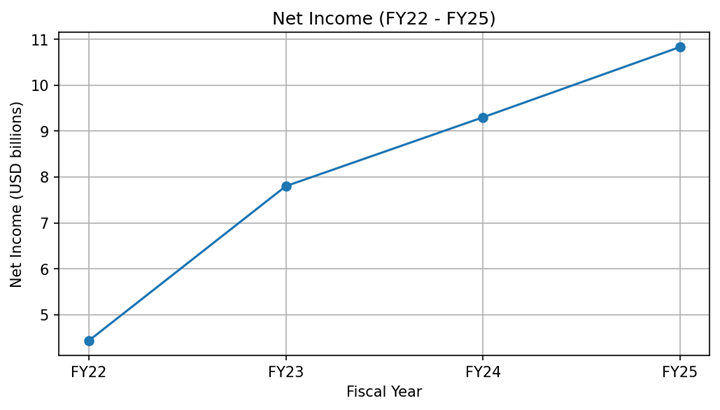
Chart 3: FY25 Revenue Mix by Segment (USD billions).
Key Developments
During the quarter, the company extended key partner agreements and launched product enhancements aimed at premium card members. American Express expanded its Centurion Lounge footprint and introduced Dining Companion features. Management highlighted ongoing investment in data analytics and artificial intelligence to support card member engagement and merchant services.
Risks and Constraints
Principal risks include credit losses, changes in consumer spending patterns, elevated fraud and claims trends, and regulatory developments affecting issuer conduct. Interest rate movements and capital market volatility may affect net interest and investment income. Execution risk exists around premium product investments and international expansion.
Outlook / Guidance
The company provided FY2026 guideposts including expected revenue growth and EPS ranges. What to watch for: quarterly revenue trends, net write‑off rates, reserve builds, performance of premium‑card products, and significant regulatory actions affecting card issuers.
Performance Summary
Shares closed lower following the release. Q4 revenue was $18.98 billion, and Q4 net income was $2.46 billion. Full‑year revenue rose to $72.23 billion. Net income increased year over year. U.S. consumers and global commercial businesses remained primary contributors to revenue.