
Business Overview
Avnet Inc (Nasdaq: AVT) is a global technology distributor focused on electronic components and related services. The company supplies components and solutions for industrial, communications, and computing markets. Avnet operates through an electronic components distribution segment and a specialist distributor segment serving design engineers and manufacturing customers.
Financial Performance
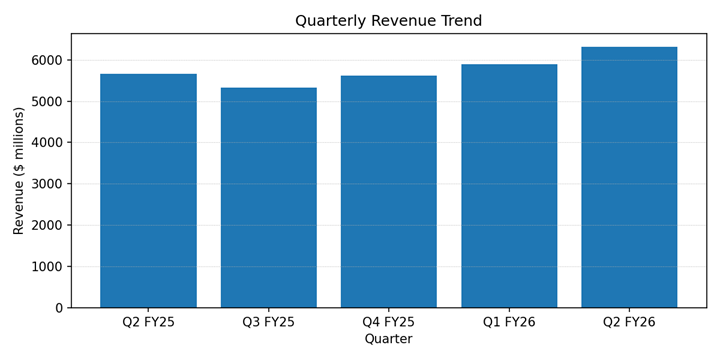
For the second quarter of fiscal 2026, consolidated revenue was $6,319.0 million. GAAP net income was $61.7 million. Revenue increased 11.6% year over year. GAAP net income declined 29.2% year over year. For fiscal 2025, annual revenue was $22,200.8 million and annual net income was $240.2 million. On an annual basis, both revenue and net income contracted year over year.
Operating Metrics
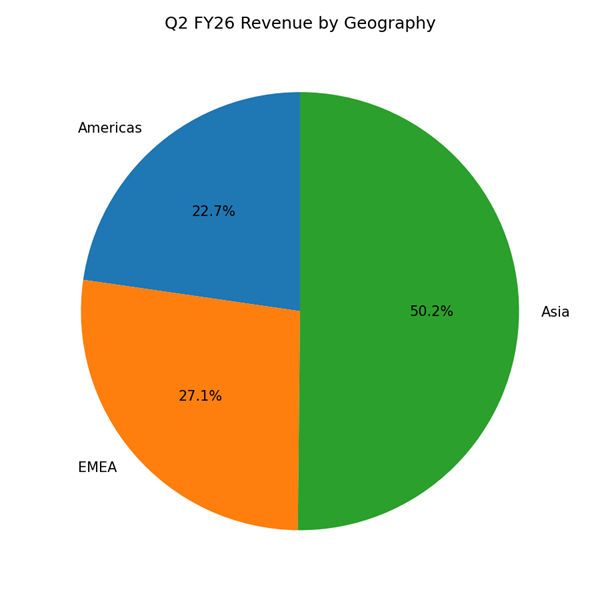
Quarterly operating cash flow in Q2 FY26 was $208 million. Inventory declined by $126 million in the quarter, taking days of inventory to 86. Available committed credit lines stood at $1.7 billion. Electronic Components sales were $5,891.9 million, and Farnell sales were $427.1 million in Q2 FY26. Geographic sales were Americas $1,435.3 million; EMEA $1,714.0 million; Asia $3,169.7 million.
Key Developments
The company reported a reduction in inventory levels and an improvement in working capital metrics in the quarter. The board authorized customary shareholder returns during the quarter in the form of dividends. No material acquisitions or divestitures were announced in the period.
Risks and Constraints
Reported risks include exposure to regional demand variability and supply chain disruptions. Inventory management remains a constraint for margin recovery. The company continues to monitor currency and component supply movements that could affect gross margins and working capital.
Outlook / Guidance
The company provided a sales range for Q3 FY26 of $6.20 billion to $6.50 billion and an adjusted diluted EPS range of $1.20 to $1.30. What to watch for: actual Q3 sales and adjusted EPS versus the guidance midpoint; regional revenue mix, particularly Asia; and inventory and cash-flow metrics.
Performance Summary
Shares moved higher on the reporting day. Q2 revenue rose year over year. GAAP net income fell year over year. Working capital trends and the Q3 guidance range are near-term items to monitor.
The company cited operational cash generation and reduced inventories as key quarter features, which the market is likely to monitor against the company’s stated guidance for the next quarter.