Molson Coors 4Q 2025 Financial Performance Overview
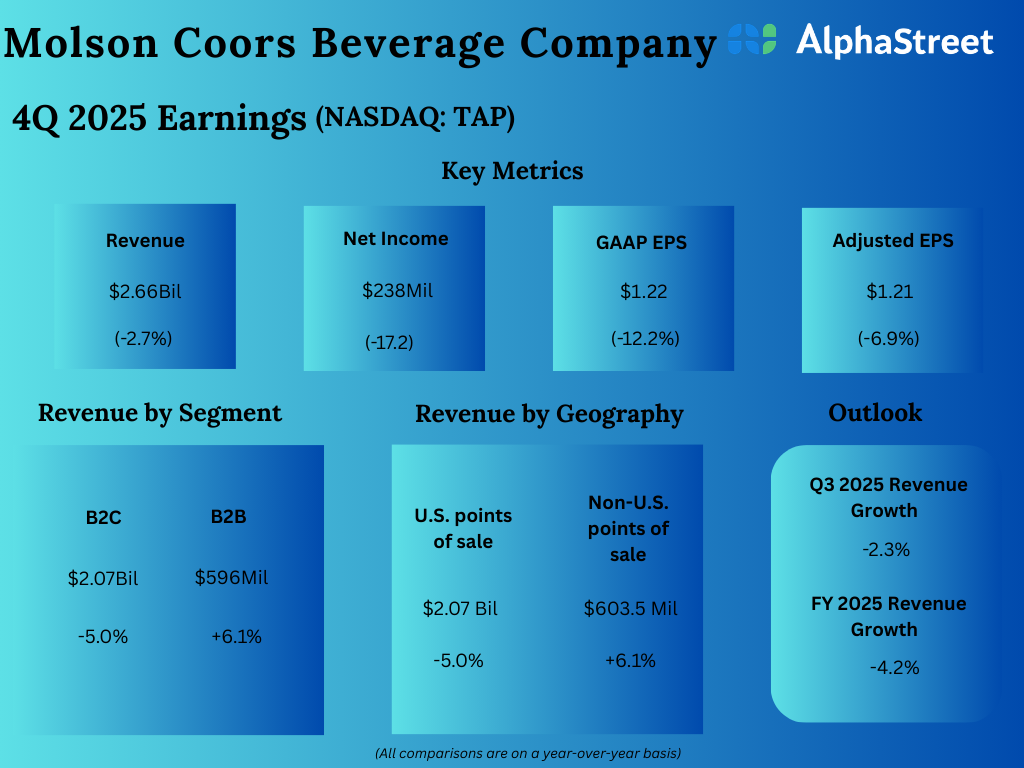
Molson Coors Beverage Company (NASDAQ: TAP) reported its earnings for the fourth quarter of 2025, revealing a year-over-year decline across all key financial metrics. Total revenue for the quarter stood at $2.66 billion, representing a decrease of 2.7% compared to the same period last year. Net income also saw a downturn, falling by 17.2% to $238 million.
Key Metrics and Earnings per Share
The company’s earnings per share (EPS) metrics reflected this downward trend. GAAP EPS was reported at $1.22, a decline of 12.2% year-over-year. Adjusted EPS, which provides another measure of profitability, came in at $1.21, down 6.9% from the prior year’s quarter.
Performance by Segment and Geography
A breakdown of revenue by segment shows divergent performance. The Business-to-Consumer (B2C) segment, which generated the majority of revenue at $2.07 billion, experienced a 5.0% decline. Conversely, the Business-to-Business (B2B) segment showed growth, with revenue increasing by 6.1% to $596 million.
This performance pattern is mirrored in the geographical data. U.S. points of sale, contributing $2.07 billion in revenue, saw a 5.0% decrease. Meanwhile, Non-U.S. points of sale grew by 6.1%, totaling $603.5 million in revenue.
Future Outlook
The provided outlook indicates negative revenue growth expectations for the near term. Q3 2025 revenue growth is projected to be -2.3%, while the full-year FY 2025 revenue growth is forecasted to be -4.2%.
