AlphaStreet Newsdesk powered by AlphaStreet Intelligence
Wall Street expects flat earnings growth when NNN REIT reports Q1 2026 results on April 30. The consensus estimate stands at $0.51 per share on revenue of $238.4M, based on projections from 3 analysts covering the retail REIT. Estimates for earnings per share range from $0.48 to $0.54, while revenue forecasts span $230.6M to $241.5M, reflecting a relatively tight band of expectations for the quarter.
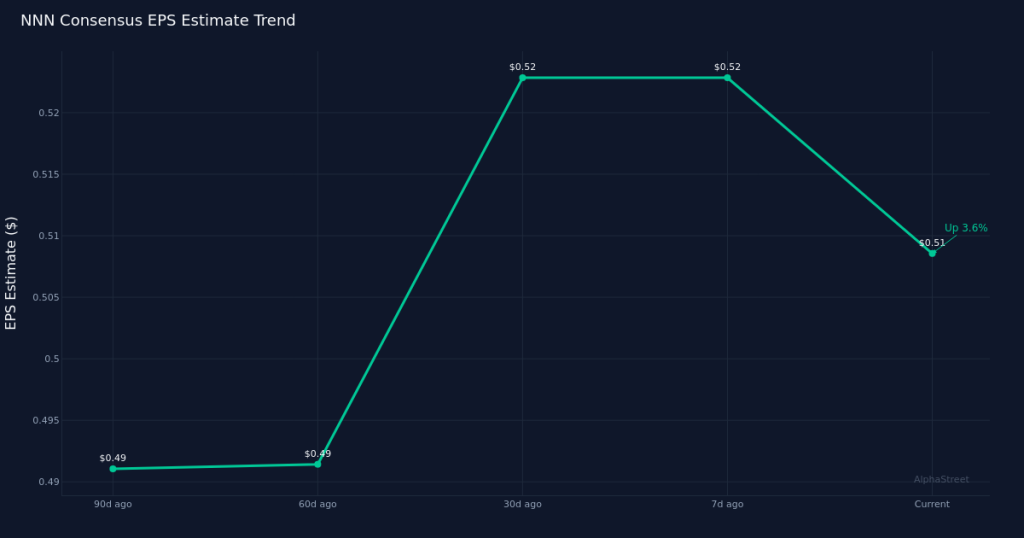
Analyst estimate revisions tell a mixed story of recent sentiment shifts. Over the past 30 days, the consensus EPS estimate has declined 1.9% from $0.52, suggesting analysts have trimmed their near-term expectations as the quarter progressed. This recent downward revision contrasts with the longer view: over the past 90 days, estimates have climbed 4.1% from $0.49. The recent pullback may reflect updated property-level data or revised occupancy assumptions, though the quarterly drift remains modest in absolute terms.
Year-over-year comparisons show minimal earnings progression but steady revenue expansion. The $0.51 consensus matches the year-ago Q1 2025 result of $0.51 per share, implying no year-over-year change in earnings. Revenue is expected to grow 3.2% from the prior-year quarter’s $230.9M, suggesting the company is generating top-line growth while maintaining earnings stability. The year-ago quarter delivered net income of $96.5M on a net margin of 41.8%, illustrating the profitability profile typical of triple-net lease REITs where rental income flows through with limited operating expense drag.
The flat earnings comparison against revenue growth implies margin dynamics warrant attention. If revenue is advancing while per-share earnings hold steady, investors should examine whether property-level yields are compressing, whether share count has increased through equity issuance to fund acquisitions, or whether interest expense has risen as the company finances portfolio expansion. The combination of revenue growth and stable earnings is common in REITs that recycle capital through dispositions and acquisitions, particularly when funding costs have shifted.
NNN REIT’s business model centers on single-tenant retail properties with long-term net leases. As a triple-net landlord, the company collects rent while tenants bear responsibility for property taxes, insurance, and maintenance, creating a low-overhead cash flow stream. The quality and creditworthiness of tenants, lease renewal rates, and the company’s ability to deploy capital into accretive acquisitions drive performance. Investors typically focus on occupancy levels, rent collection rates, and the spread between acquisition cap rates and the company’s cost of capital.
The stock’s positioning heading into the report will influence how investors interpret results. Retail REITs have navigated a complex environment balancing tenant health in categories ranging from convenience stores to quick-service restaurants against evolving consumer patterns and interest rate impacts on property valuations. Where the shares trade relative to net asset value and how the dividend yield compares to peers often determines whether in-line results are viewed positively or disappointingly.
Property acquisition activity and portfolio composition merit close examination. For a net lease REIT, the pace of investment, the initial yields captured on new properties, and the diversification across tenant industries and geographies shape long-term earnings power. Any commentary on the transaction pipeline, capital recycling through dispositions, or changes in tenant credit quality will provide insight into whether the current earnings trajectory is sustainable or poised to inflect.
This content is for informational purposes only and should not be considered investment advice. AlphaStreet Intelligence analyzes financial data using AI to deliver fast and accurate market information. Human editors verify content.