Categories AlphaGraphs, Consumer, Earnings

Procter & Gamble reports mixed Q2 results

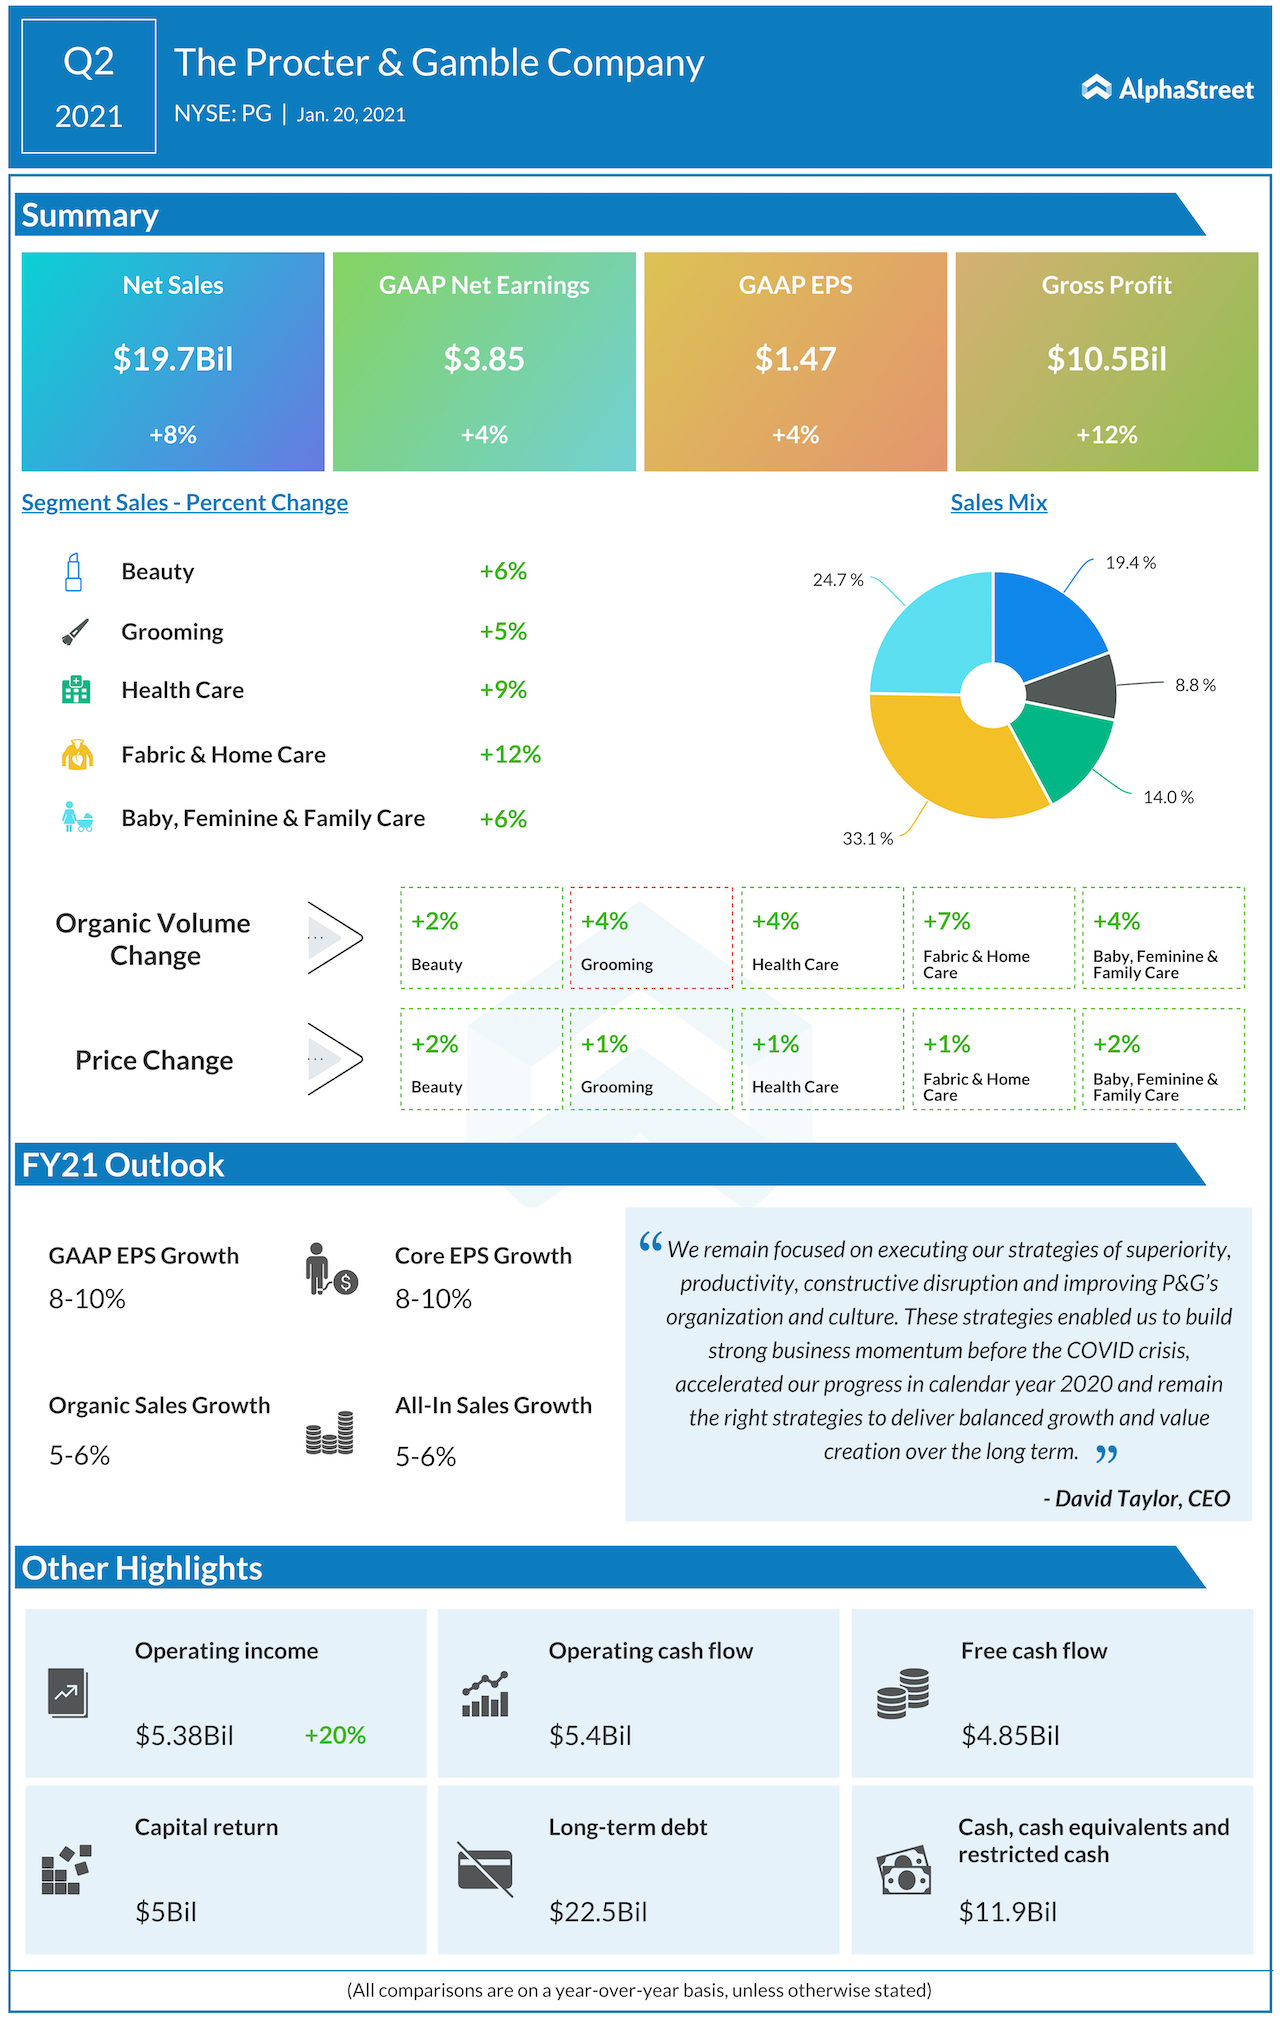
The Procter & Gamble Company (NYSE: PG) reported second-quarter 2020 financial results before the regular market hours on Wednesday. The consumer goods major reported second-quarter revenue of $19.7 billion, up 8% year-over-year, and higher than the Wall Street projection. Meanwhile, net income of $1.47 per share missed the target that analysts had predicted.

PG shares rose 1.7% immediately following the announcement. The stock has gained a modest 5% in the trailing 12 months.  

The Procter & Gamble company Q2 2021 earnings

Looking forward to listening to management / analyst comments on the results? Stay tuned here for Procter & Gamble Q2 earnings call transcript

Prior performance

  • P&G Announces Fiscal Year 2021 First Quarter Results
  • Procter and Gamble reports Q4 2020 earnings results
  • Procter and Gamble (PG) Q2 2020 earnings infograph

Most Popular

Infographic: Highlights of Halliburton’s (HAL) Q1 2024 earnings results

Energy giant Halliburton Company (NYSE: HAL) Tuesday announced financial results for the first quarter of 2024, reporting lower earnings and a modest increase in revenues. First-quarter revenue edged up 2%

UPS Earnings: United Parcel Service Q1 2024 revenue and earnings fall

United Parcel Service, Inc. (NYSE: UPS) Tuesday reported lower revenues and adjusted profit for the first quarter of 2024. The company reaffirmed its full-year 2024 guidance. On an adjusted basis,

Key highlights from Philip Morris’ (PM) Q1 2024 earnings results

Philip Morris International Inc. (NYSE: PM) reported first quarter 2024 earnings results today. Net revenues increased 9.7% year-over-year to $8.8 billion. Organic revenue growth was 11%. Net earnings attributable to

Add Comment
Loading...
Cancel
Viewing Highlight
Loading...
Highlight
Close
Top