
Rexford Industrial Realty, Inc. (NYSE: REXR) reported fourth-quarter and full-year 2025 results showing higher core funds from operations and continued leasing activity across its Southern California industrial portfolio.
For the fourth quarter ended Dec. 31, 2025, the company reported Core FFO of $0.59 per share, compared with $0.58 per share in the same period a year earlier. Same-property cash net operating income rose 2.8% year over year, while same-property net effective NOI increased 0.4%.
For the full year 2025, Core FFO totaled $2.40 per share, up 2.6% from the prior year. Same-property cash NOI grew 4.3% for the year, and same-property net effective NOI increased 1.1%.
Operating and leasing performance
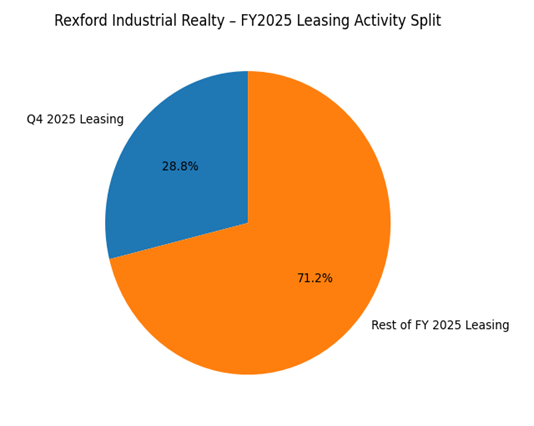
Rexford leased 3.0 million square feet during the fourth quarter. Average same-property occupancy was 96.8%, with ending occupancy at 96.5%. Net effective leasing spreads for the quarter were 22.0%, while cash leasing spreads were 9.0%.
For the full year, leasing activity totaled 10.4 million square feet. Average same-property occupancy was 96.4%, with net effective leasing spreads of 23.4% and cash leasing spreads of 10.7%. Average embedded rent steps were 3.6% for the year.
Capital recycling and balance sheet
During the fourth quarter, Rexford completed one disposition for a total sales price of $30 million, representing 101,000 square feet. For the full year, the company completed seven dispositions totaling $218 million and 590,000 square feet, with an unlevered internal rate of return of 12.4%.
Disposition proceeds during 2025 were deployed into share repurchases totaling $250 million. The company reported that this capital recycling contributed $0.02 to Core FFO per share for the year.
At year-end, Rexford reported net debt to adjusted EBITDAre of 4.4x, total liquidity of approximately $1.4 billion, and 100% fixed-rate debt. Weighted-average debt maturity was 3.3 years, and 97% of debt was unsecured.
Development and repositioning activity
During the fourth quarter, Rexford stabilized seven projects totaling 749,000 square feet, with total investment of $306 million and achieved unlevered stabilized yield of 5.0%. For the full year, 21 projects totaling 2.2 million square feet were stabilized, representing $798 million of total investment and an achieved unlevered stabilized yield of 5.5%.
Leased annualized cash NOI from repositioning and development projects reached $12 million in the quarter and $39 million for the full year.
Guidance framework
The company initiated 2026 Core FFO guidance of $2.35 to $2.40 per share. Same-property portfolio cash NOI is expected to range between -2.0% and -1.0%, with net effective NOI between -2.5% and -1.5%. Planned dispositions are expected to total $400 million to $500 million, while repositioning and development starts are projected at 1.1 million square feet.
Performance summary
Rexford reported higher Core FFO year over year for both the quarter and full year. Leasing volumes increased, occupancy remained elevated, and capital recycling activity continued through dispositions and share repurchases. The company outlined its 2026 guidance ranges and balance sheet position, closing the year with investment-grade credit metrics