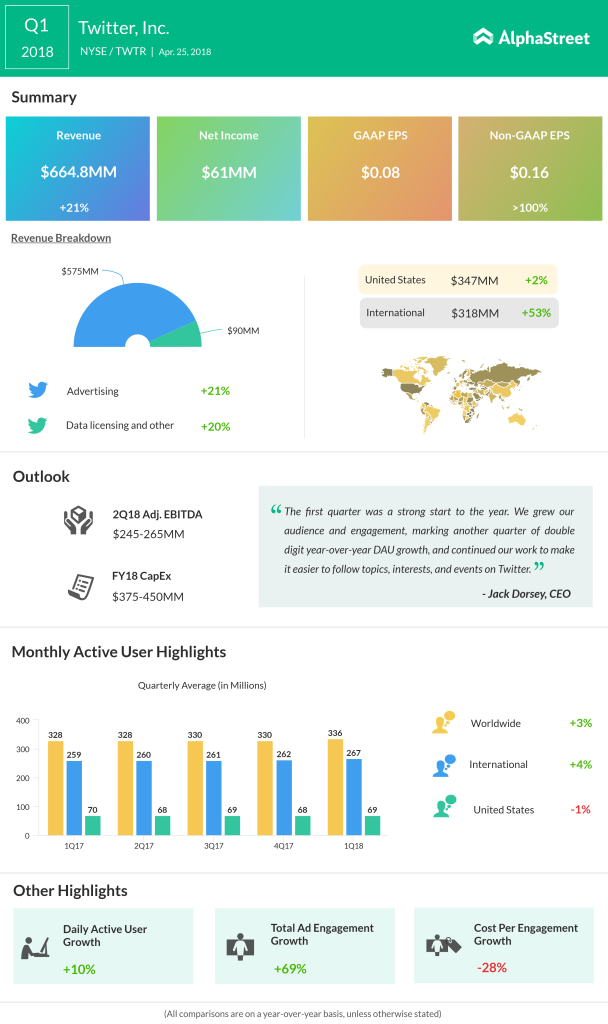
Microblogging site Twitter Inc. (TWTR) posted a 21% increase in total revenues to $665 million for the first quarter of 2018 compared to the prior year period.
GAAP net income was $61 million or $0.08 per share in Q1 2018, representing a net margin of 9%. This compares to a loss of $62 million or $0.09 per share for the first quarter of 2017. Adjusted net income was $123 million or $0.16 per share.
Twitter’s quarterly results beat market expectations, sending shares climbing as high as 13% following the earnings release.
Average monthly active users (MAU) increased 3% year over year to 336 million for the quarter while average daily active users (DAU) rose 10% year over year. The MAU metric reflects 69 million average monthly active users in the US and 267 million average international monthly active users.
Advertising revenue amounted to $575 million, an increase of 21% year over year. Owned and operated advertising revenue grew 28% year over year during Q1 2018, helped by audience growth and differentiated ad product features. Non-owned and operated advertising revenue fell 28% due to a decline from the deprecated TellApart product. Excluding this, non-owned and operating revenues would have increased 18%.
Twitter’s upbeat results sent shares climbing as high as 13% following the earnings release
Video now accounts for half of Twitter’s advertising revenues and was its fastest-growing ad format in Q1 2018. Data licensing and other revenue increased 20% year over year.
US revenues increased 2% to $347 million while international revenue grew 53% to $318 million year over year.
For the second quarter of 2018, the company expects adjusted EBITDA to be between $245 million and $265 million. For the full year of 2018, Twitter expects capital expenditures to come in between $375 million and $450 million.
