Categories AlphaGraphs, Consumer, Earnings

Darden Restaurants (DRI) Q4 profit and sales increase; comp sales up 4%

Darden Restaurants, Inc. (NYSE: DRI) announced financial results for the fourth quarter of 2023, reporting higher earnings and sales. The restaurant chain also provided guidance for fiscal 2024.

Darden Restaurants Q4 2023 earnings infographic

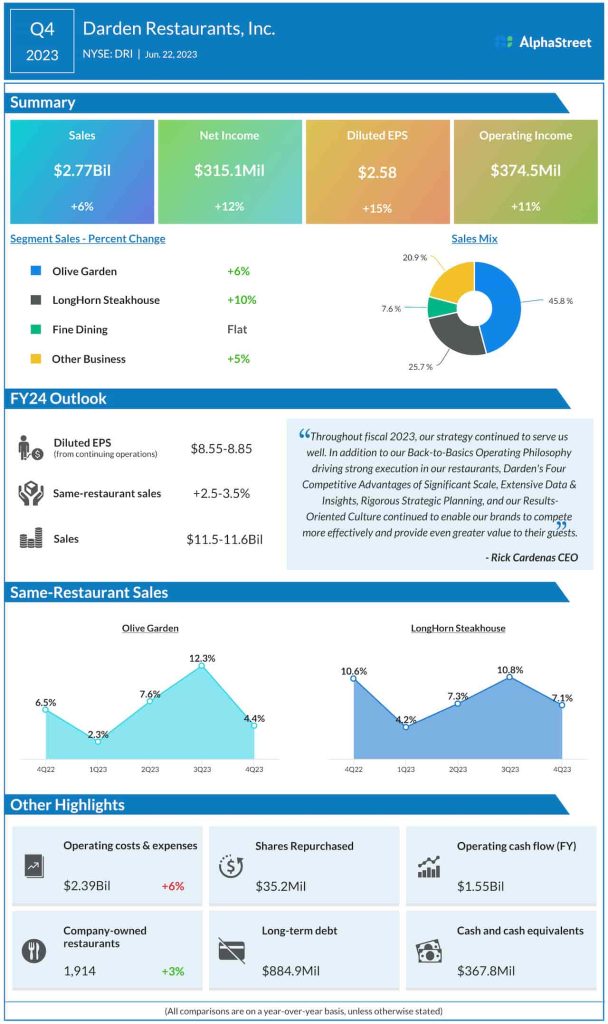
Net income increased to $315.1 million in the most recent quarter from $281.7 million a year earlier. On a per-share basis, May-quarter earnings moved up to $2.58 from $2.24 per share in the corresponding period of 2022.

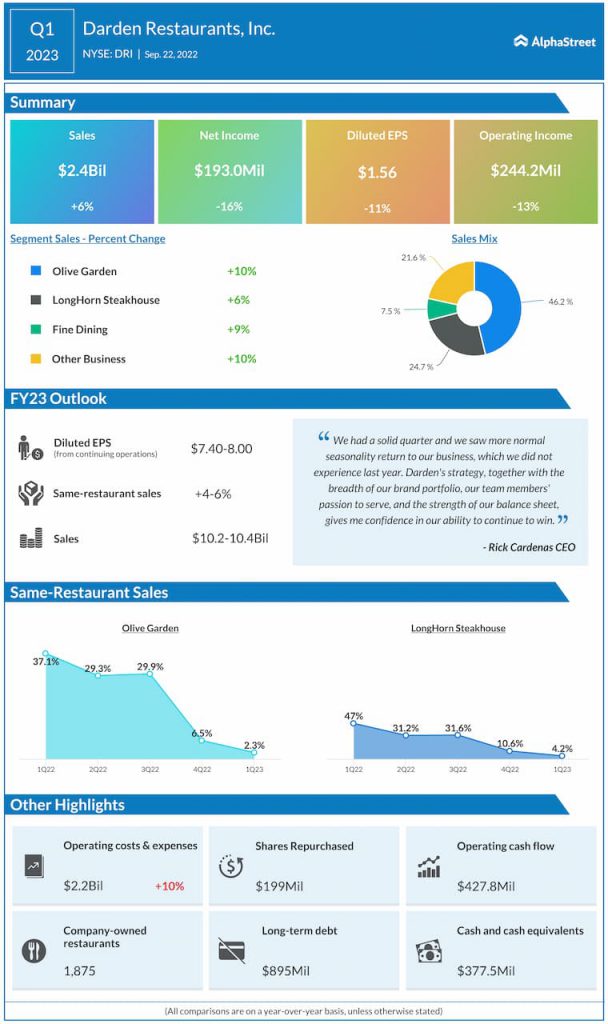
At $2.77 billion, net sales were up 6% year-over-year in the fourth quarter. Same restaurant sales at Olive Garden and LongHorn Steakhouse increased by 4.4% and 7.1% respectively. Consolidated same-store sales growth was 4%.

“In addition to our Back-to-Basics Operating Philosophy driving strong execution in our restaurants, Darden’s Four Competitive Advantages of Significant Scale, Extensive Data & Insights, Rigorous Strategic Planning, and our Results-Oriented Culture continued to enable our brands to compete more effectively and provide even greater value to their guests,” said Rick Cardenas, chief executive officer of Darden.

Prior Performance

  • Darden Restaurants Q2 2023 earnings infographic
  • Darden-Restaurants-Q1-2023-Earnings-Infographic
  • Darden Restaurants Q4 2022 earnings infographic

Looking for more insights on the earnings results? Click here to access the full transcripts of the latest earnings conference calls!

Most Popular

Earnings Preview: What to look for when Netflix (NFLX) reports Q4 2025 results

Netflix, Inc. (NASDAQ: NFLX) is expected to report Q4 results on January 20, amid expectations for strong revenue and earnings growth. The company is navigating a shifting streaming landscape where

What to look for when United Airlines (UAL) reports its Q4 2025 earnings results

Shares of United Airlines (NASDAQ: UAL) stayed red on Thursday. The stock has gained 15% over the past three months. The airline is scheduled to report its earnings results for

Infographic: How Constellation Brands (STZ) performed in Q3 2026

Constellation Brands, Inc. (NYSE: STZ) reported net sales of $2.22 billion for the third quarter of 2026, down 10% year-over-year. Organic net sales were down 2%. Net income attributable to

Add Comment
Loading...
Cancel
Viewing Highlight
Loading...
Highlight
Close
Top