Categories AlphaGraphs, Earnings, Finance

Infographic: Morgan Stanley (MS) Q2 2020 earnings results

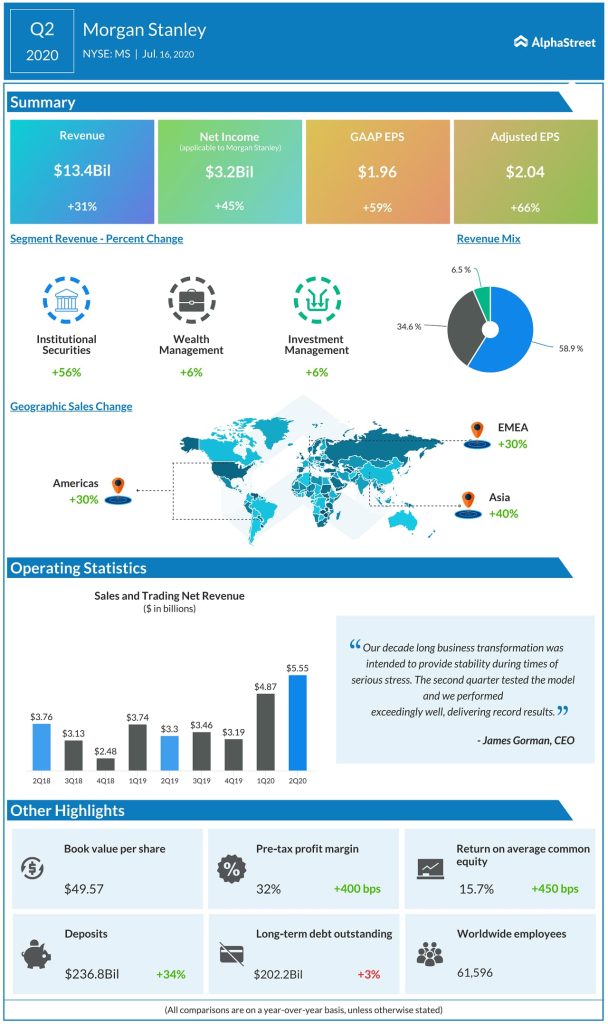
Morgan Stanley (NYSE: MS) reported a better-than-expected bottom and top line results for the second quarter of 2020. Adjusted EPS of $2.04 and revenue of $13.4 billion, both increased year-over-year and excelled the market’s estimates. Revenue increased 31% in the quarter, fueled by the strong growth in investment banking and trading revenues.

MS stock was trading up about 1% in the pre-market trading session.

Morgan Stanley (MS) Q2 2020 Earnings Infograph

Looking forward to listening to management/ analysts comments on Q2 results? Stay tuned here for Morgan Stanley Q2 2020 earnings call transcript

“Our decade long business transformation was intended to provide stability during times of serious stress. The second quarter tested the model and we performed exceedingly well, delivering record results,” said CEO James Gorman.

Most Popular

Infographic: How Halliburton (HAL) performed in Q1 2025

Halliburton Company (NYSE: HAL) reported its first quarter 2025 earnings results today. Total revenue was $5.4 billion compared to $5.8 billion in the same period a year ago. Net income

GE Aerospace Q1 profit jumps on 11% revenue growth; reaffirms FY25 outlook

GE Aerospace (NYSE: GE) reported a sharp increase in earnings for the first quarter of 2025, driven by an 11% year-over-year growth in revenues. The management reaffirmed its full-year 2025

Key metrics from Kimberly-Clark’s (KMB) Q1 2025 earnings results

Kimberly-Clark Corporation (NYSE: KMB) reported its first quarter 2025 earnings results today. Net sales of $4.8 billion were 6% lower than the year-ago period. Organic sales decreased 1.6%.   Net

Add Comment
Loading...
Cancel
Viewing Highlight
Loading...
Highlight
Close