Performance Review
JD.Com, Inc. (NASDAQ:JD) recently released its fourth-quarter 2025 earnings, revealing substantial year-over-year contractions across its key profitability metrics. Despite the reported losses on the income statement, the data shows that the company maintained a well-capitalized balance sheet and generated positive operating cash flow during the period.
Income Statement: Revenue and Expenses
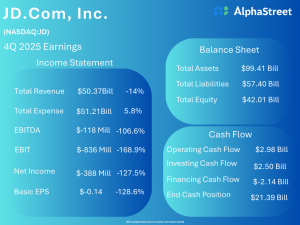
For 4Q 2025, JD.Com reported Total Revenue of $50.37 billion, which marks a 14% decline compared to the same period last year. Conversely, Total Expense for the quarter increased by 5.8% to reach $51.21 billion. This divergence—where operating costs grew while top-line revenues contracted—created an imbalance that severely impacted the company’s overall profitability for the quarter.
Profitability Metrics
The misalignment of revenue and expenses pushed JD.Com into negative territory across all major earnings indicators. EBITDA was reported at $-118 million, representing a steep 106.6% year-over-year drop. The operational deficit was further highlighted by an EBIT of $-836 million, marking a 168.9% decline. Ultimately, the company recorded a Net Income of $-388 million, down 127.5% from the prior year. This bottom-line loss translated directly to a Basic EPS of $-0.14, representing a 128.6% decrease.
Balance Sheet Health
Despite the quarterly losses, JD.Com’s balance sheet highlights a massive asset base. The company ended the period with Total Assets amounting to $99.41 billion. Total Liabilities were recorded at $57.40 billion. Consequently, JD.Com’s Total Equity stands at $42.01 billion, indicating a financial structure that retains considerable foundational value despite immediate income challenges.
Cash Flow Dynamics
Cash flow data indicates continued liquidity generation. Operating Cash Flow remained positive at $2.98 billion, and Investing Cash Flow added $2.50 billion. These inflows were partially offset by Financing Cash Flow outflows of $-2.14 billion. Ultimately, JD.Com concluded the fourth quarter with a highly robust End Cash Position of $21.39 billion.