AlphaStreet Newsdesk powered by AlphaStreet Intelligence
Wall Street’s Benchmark. American International Group, Inc. is set to report first quarter 2026 results on May 1, with the consensus of 19 analysts expecting earnings of $1.88 per share on revenue of $7.01B. The EPS estimate range spans from $1.74 to $1.96, while revenue projections cluster tightly between $6.99B and $7.03B, suggesting broad agreement on the top-line outlook for the diversified insurer.
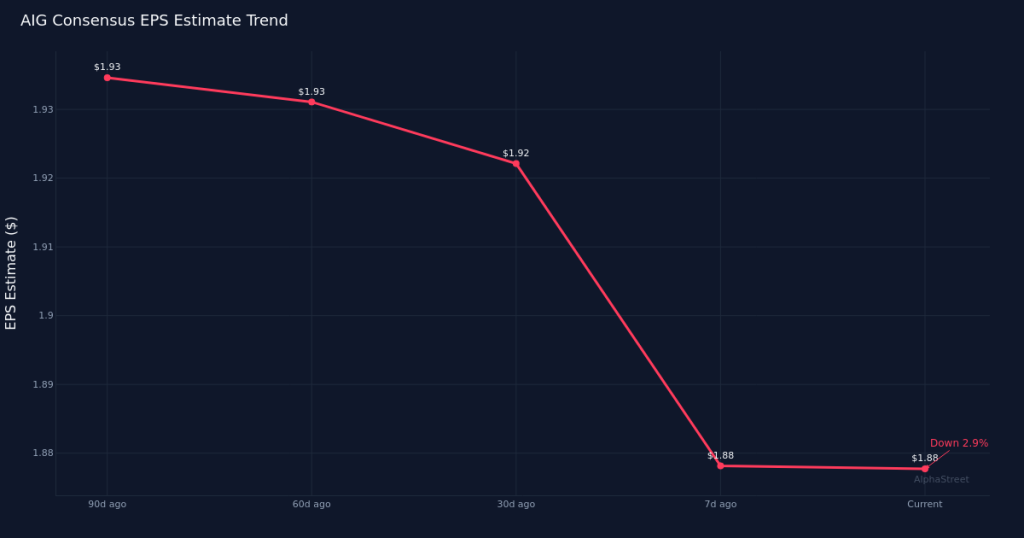
Downward Drift in Estimates. Analyst sentiment has deteriorated in recent months, with the EPS consensus declining 2.1% over the past 30 days from $1.92 and down 2.6% over the past 90 days from $1.93. This gradual erosion in expectations suggests analysts have grown more cautious, potentially reflecting concerns about underwriting conditions, investment yields, or competitive pressures in AIG’s core insurance markets. The steady downward revision pattern typically signals that Street confidence has waned as the quarter has progressed, making the bar for a positive surprise modestly lower than it stood earlier this year.
Robust Year-Over-Year Comparison. The consensus EPS estimate of $1.88 would represent a substantial improvement from the $1.17 reported in the year-ago quarter, translating to an implied year-over-year increase of 60.7%. Revenue growth appears more modest, with the $7.01B consensus marking a 3.4% advance from the $6.78B recorded in Q1 2025. This divergence between earnings growth and revenue expansion suggests meaningful margin improvement or operational efficiency gains over the past year. The year-ago quarter produced net income of $702.0M on a net margin of 10.4%, establishing a baseline for profitability that investors will measure against current quarter performance to assess whether AIG has sustained or expanded its bottom-line efficiency.
Margin Profile in Focus. The substantial implied earnings acceleration relative to revenue growth underscores the importance of examining AIG’s underwriting discipline and expense management. For a diversified insurer, the ability to grow earnings at a pace nearly eighteen times faster than revenue growth points to potential improvements in combined ratios, investment income, or cost structure rationalization. Whether this profit leverage proves sustainable or reflects one-time benefits will be a central question as management discusses reserve adequacy, catastrophe losses, and the pricing environment across commercial and personal lines.
Operational Metrics Matter. Beyond the headline figures, investors should scrutinize the performance across AIG’s major business segments, including General Insurance and Life and Retirement. Premium growth trends, retention rates, and new business production will indicate whether the company is gaining or losing competitive position. Investment portfolio yields and the mark-to-market impact of credit spreads and equity markets will influence net investment income, a critical component of insurer profitability. Any commentary on capital deployment—whether through share repurchases, debt reduction, or strategic acquisitions—will signal management’s confidence in the sustainability of current earnings power.
Historical Context for Expectations. Understanding AIG’s track record of meeting, beating, or missing analyst expectations would provide valuable context for how much weight to place on the consensus forecast. Companies with consistent execution tend to trade with less volatility around earnings events, while those with spotty performance face wider price swings regardless of absolute results. The tight revenue estimate range suggests analysts feel confident in their modeling of premium trends, though the wider EPS range indicates more uncertainty around profitability drivers.
Regulatory and Macroeconomic Backdrop. The insurance sector operates within a complex web of regulatory requirements and economic sensitivities. Interest rate movements affect both investment income and the present value of loss reserves, creating asymmetric impacts on reported earnings. Inflation trends influence claims costs, particularly in casualty lines with long-tail liabilities. Management’s commentary on how these macro forces are affecting underwriting decisions and reserve positions will help investors gauge whether current profitability is cyclically elevated or represents a durable new baseline.
This content is for informational purposes only and should not be considered investment advice. AlphaStreet Intelligence analyzes financial data using AI to deliver fast and accurate market information. Human editors verify content.