Shares of Alibaba Group Holding Limited (NYSE: BABA) were up 7% on Thursday after the Chinese ecommerce giant beat earnings expectations for its second quarter of 2023. Revenue, however, missed projections as a slowdown in spending and pandemic-related curbs pressured the top line. The stock has dropped 29% year-to-date.
Mixed results
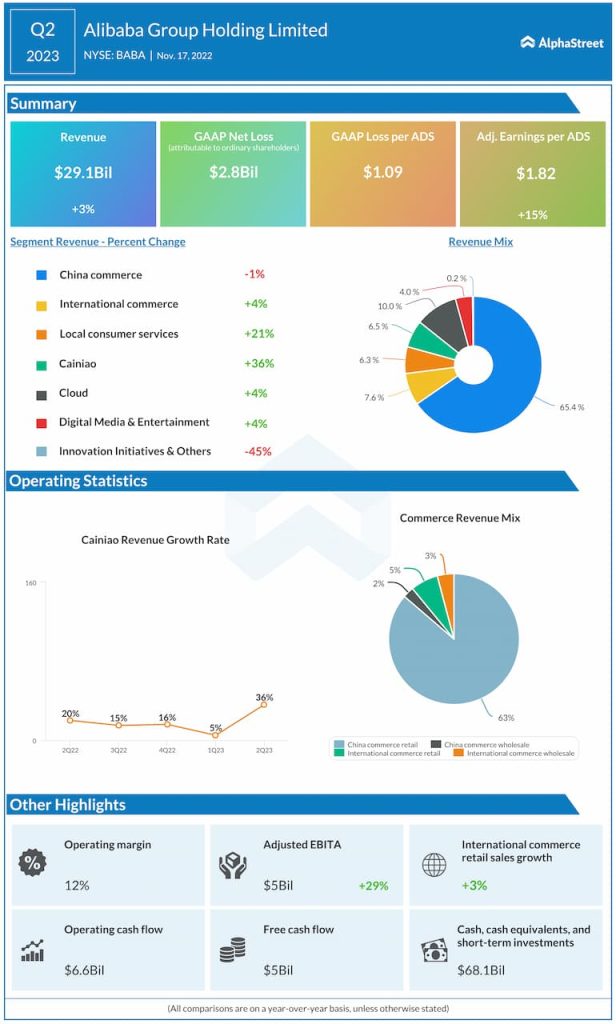
Alibaba reported total revenue of $29.1 billion in Q2 2023, which was up 3% from the same period a year ago. The top line missed estimates and the 3% growth recorded during the quarter was slower than expected. The company delivered adjusted EPS of $1.82, which was up 15% year-over-year and ahead of expectations.
Commerce
Alibaba’s China commerce segment includes its retail businesses such as Taobao, Tmall, Taobao Deals, Taocaicai and Freshippo among others. In Q2, online physical goods gross merchandise volume (GMV) on Taobao and Tmall declined in the low single digits compared to the year-ago period due to weak consumption demand, pandemic-related curbs and rising competition. However, declines in categories like apparel and accessories were narrower compared to the year-ago period and the company saw steady demand for categories like healthcare products and pet care.
The company also did not disclose the sales numbers for its Singles Day shopping festival, merely stating that results were in line with last year. Alibaba’s bargain platform Taobao Deals helps manufacturers sell directly to consumers (M2C). In Q2, paid GMV of M2C products grew more than 60% YoY. Taocaicai, its grocery and fresh goods pickup service, saw GMV growth of over 40% YoY. The company was able to reduce losses in this business by optimizing pricing and reducing costs during the quarter.
Within international commerce, the combined number of orders of Lazada, AliExpress, Trendyol, and Daraz declined 3% YoY, mainly due to declining orders of Lazada and AliExpress. Rising logistics costs and depreciation of the Euro created headwinds for cross-border e-commerce demand in Europe during the quarter.
Cloud
In Q2 2023, total revenue from the Cloud segment, before inter-segment elimination, was $3.76 billion. Revenue after inter-segment elimination grew 4% YoY to $2.91 billion, driven mainly by growth in public cloud and partly offset by a fall in hybrid cloud revenue.
Revenue from non-Internet industries grew 28% YoY and made up 58% of total Cloud revenue. This revenue growth was driven by financial services, telecommunications and public services industries. Revenue from customers in the Internet industry dropped 18% YoY in Q2 mainly due to the loss of revenue from a top customer and slowing demand from other customers.
Click here to access the infographics of the latest earnings reports