Categories AlphaGraphs

Infographic: US IPO Trends Since Financial Crisis

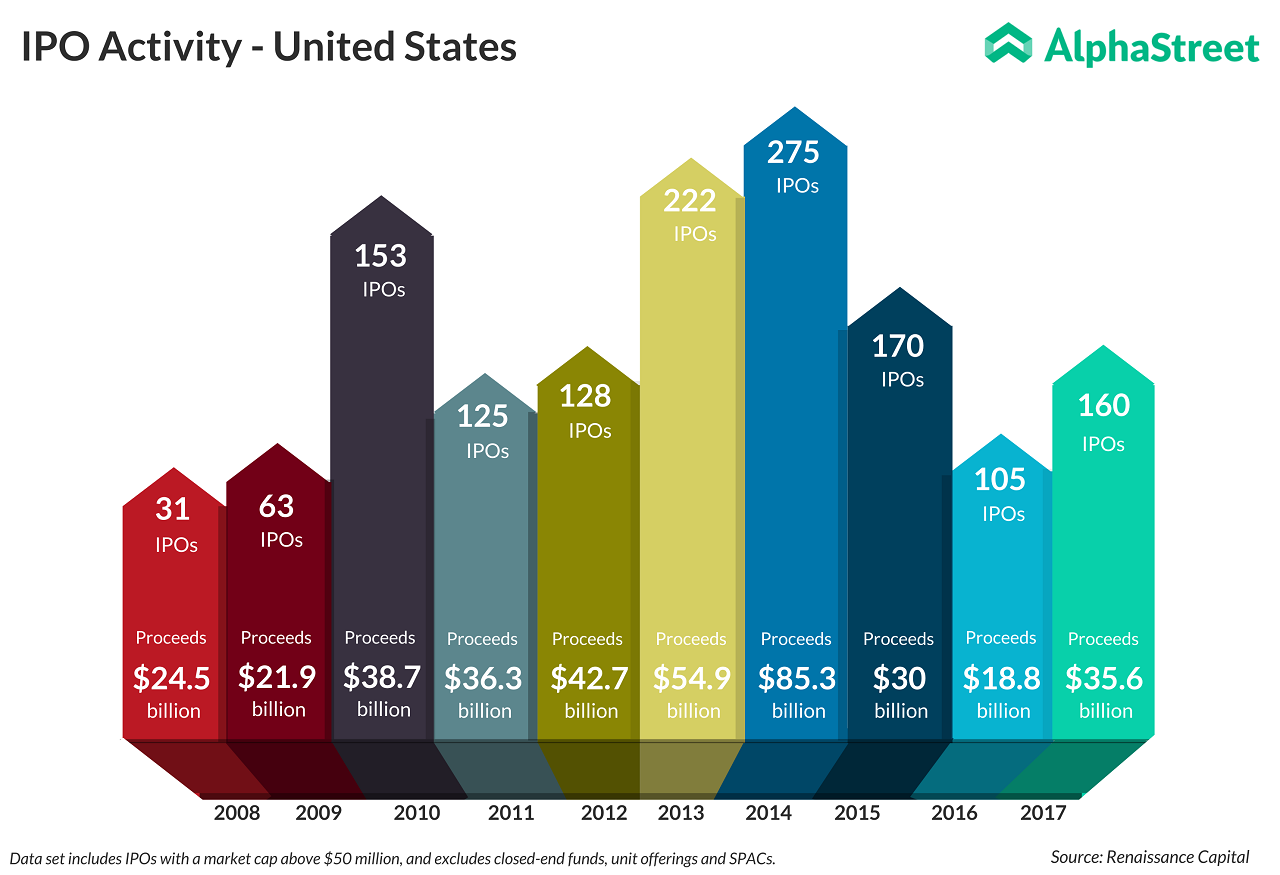
Global IPO market made a big comeback in 2017 since the financial crisis. After a grim IPO activity in 2016, the US stock market flourishes on a bull-run in 2017. There were 160 IPOs in the US in 2017 raising $35.6 billion, a rise of 89% in terms of proceeds and 52% by volume compared with 2016, according to Renaissance Capital.

Raising $3.9 billion in proceeds, Snap Inc. was the largest listing on US exchanges for 2017, becoming the first largest tech listing in the US since Alibaba in 2014 and also the largest US-based tech listing since Facebook in 2012. A perfect stage has been set for a strong IPO market in 2018 as several multi-billion dollar companies are expected to make their debut.

United States IPO activities since financial crisis
US IPO activities since 2008

Most Popular

Infographic: Highlights of Halliburton’s (HAL) Q1 2024 earnings results

Energy giant Halliburton Company (NYSE: HAL) Tuesday announced financial results for the first quarter of 2024, reporting lower earnings and a modest increase in revenues. First-quarter revenue edged up 2%

UPS Earnings: United Parcel Service Q1 2024 revenue and earnings fall

United Parcel Service, Inc. (NYSE: UPS) Tuesday reported lower revenues and adjusted profit for the first quarter of 2024. The company reaffirmed its full-year 2024 guidance. On an adjusted basis,

Key highlights from Philip Morris’ (PM) Q1 2024 earnings results

Philip Morris International Inc. (NYSE: PM) reported first quarter 2024 earnings results today. Net revenues increased 9.7% year-over-year to $8.8 billion. Organic revenue growth was 11%. Net earnings attributable to

Comments

  1. Pingback: uplay168

Tags

Add Comment
Loading...
Cancel
Viewing Highlight
Loading...
Highlight
Close
Top