User metrics are said to be the lifeline of social media companies and tend to point out the company’s future growth potential. Let’s look at the user metric trends of the three major ones.
This is Part 2 of AlphaStreet’s Social Media stock coverage. READ PART 1 HERE.
For its most recent quarter, Facebook reported increases in daily and monthly active users on both a year-over-year and sequential basis. On a YoY basis, both DAUs and MAUs increased 11% while sequentially, both saw slight increases of over 1%.
On a regional basis, the US & Canada remained flat sequentially while Europe saw a drop in daily active users (DAUs). Looking at the sequential quarterly trend over the past one year, DAUs in the US & Canada have remained somewhat stagnant with fluctuations in increases and decreases between the second quarters of 2017 and 2018.
The US & Canada DAUs remained unchanged from the first quarter of 2018 to the second quarter of 2018 at 185 million. Europe too shows a slow growth rate sequentially over the past one year with the latest quarter posting a decline of 1%.
The Asia-Pacific and Rest of World regions make up for the slow growth in the North American and European regions. Asia-Pacific denotes a relatively healthy sequential trend over the past one year while the Rest of World segment, despite lagging in momentum versus Asia-Pacific, has managed to avoid user declines over the same period.
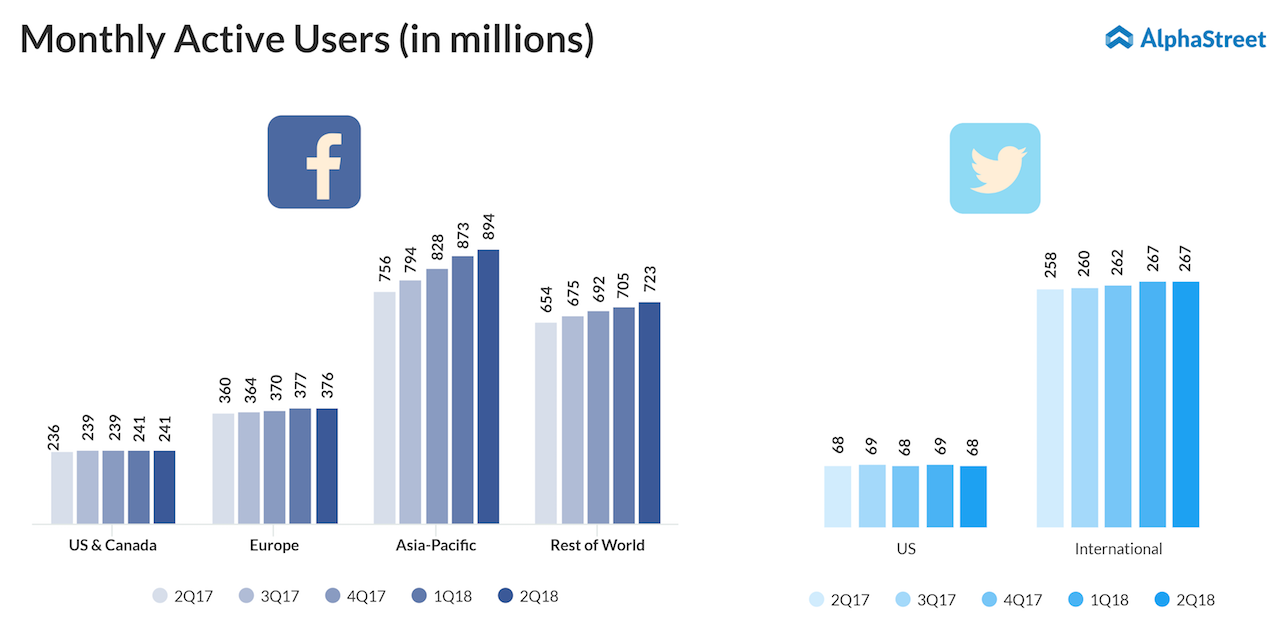
Monthly active users (MAU) display a similar sequential trend over the past year with the US & Canada showing a slow growth rate and the user numbers staying the same for the first and second quarter of 2018 at 241 million. Europe too has a relatively slow growth rate with a sequential decline of 1 million users from the first quarter to the second quarter of 2018.
Asia-Pacific and Rest of World maintain the same trends in MAUs as in DAUs with the Asia-Pac region surpassing the Rest of World in user growth momentum. The Cambridge Analytica incident and the subsequent GDPR regulations played a fair part in the user number slowdown in the US, Canada, and Europe between the first and second quarters of 2018.
Total revenue from the US & Canada and Europe were $6.2 billion and $3.3 billion respectively in Q2 2018. During the first quarter of 2018, revenues from all regions, barring Asia-Pacific, saw declines but they all managed to see a pickup in the second quarter.
Advertising revenues totaled $6.1 billion from the US & Canada and $3.2 billion from Europe during Q2 2018. Revenues from the Asia-Pacific and Rest of World were $2.2 billion and $1.3 billion respectively. All regions except Asia-Pacific saw declines in ad revenue during Q1 2018 which picked up going into the second quarter.
For the second quarter of 2018, Twitter posted year-over-year increases in monthly active users both worldwide and internationally, but MAUs remained flat year-over-year in the US. Looking at the sequential trend over the past one year, Twitter has seen stagnant growth with a decline in the user numbers for the US and worldwide in the just-concluded quarter. International MAUs remained unchanged in Q1 and Q2 2018 at 267 million.
Twitter, which has also faced criticism over toxic content, attributed the sequential decrease in user numbers to the removal of suspicious accounts. Like Facebook, Twitter gets the majority of its revenues from advertising.
Twitter’s total revenues, as well as advertising revenues, have seen growth sequentially over the past year with the exception of the first quarter of 2018 during which ad revenues dropped leading to a fall in total revenues.
Looking at ad revenues by geography, the US has seen fluctuations in ad revenue over the past year. Internationally, ad revenue growth has remained consistent except for the first quarter of 2018 when the company saw a decline which also led to a decrease in worldwide ad revenues.
Advertising revenues saw a 1% sequential growth in Q2 2018 in the US while international ad revenue grew a healthy 7% leading to a 4% growth in worldwide ad revenues.
Snap
During its most recent quarter, Snap posted an 8% year-over-year increase in its global daily active users. Regionally, both North America and Europe posted YoY increases of 7% while Rest of World posted an increase of 12%.
Sequentially, however, all regions posted declines. Looking at the sequential trend from Q2 2017 to Q2 2018, Snap posted consistent growth in daily user numbers on a global basis till Q1 2018 but the numbers fell in Q2 2018.
Regionally, North America and Rest of World saw consistent growth in users sequentially with a drop in the second quarter of this year. In Europe, the user count remained flat in the second and third quarters of 2017 followed by increases in the next two quarters before another decline in Q2 2018.
Snap gets the majority of its revenues from North America. The company’s revenues increased on a year-over-year and sequential basis both globally and across all its regions during the second quarter of 2018.
Looking at the sequential trend over the past one year, global revenues and revenues in the North America and Europe regions grew consistently before dropping in the first quarter of 2018 and then picking up again in the second quarter. Rest of World revenues have increased steadily over the past one year with no declines.
This is Part 2 of AlphaStreet’s Social Media stock coverage. READ PART 1 HERE.

