Binod Shankar CFA
Whether you are an owner, FP&A manager, banker, equity analyst, or an investor, what numbers and ratios should you focus on and WHY? What should you ignore? What rarely used MODELS and techniques should you now deploy?
Sector elasticity
Before we dive into the numbers, it is essential to take a few steps back and see how badly sectors have been and will continue to be affected.
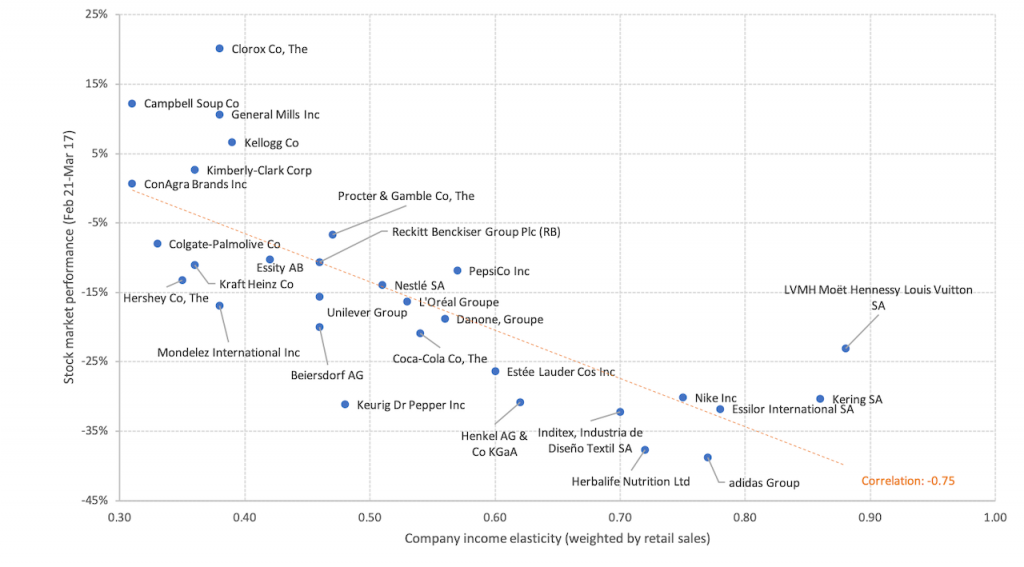
Income elasticities, which measure category volume sales change relative to GDP change, appear to be a good measure of company/business risk. There is a high correlation of this elasticity with the recent stock market performance.

- As you can see, the lower the elasticity, the lower the fall in stock prices and hence the lower the company risk.
- Adidas, Nike and LVMH have higher COVID-19 risk exposure among select FMCG companies, while Kraft Heinz and Kimberly-Clark, which are less dependent on discretionary spending, appear to be less exposed.
- Fast Moving Consumer Goods (“FMCG”) is a relative safe haven compared to the broader market as it is less dependent on discretionary spending.
- Apparel, luxury and discretionary goods companies face greater risk exposure along with travel and transportation.
Cash
Revenue
is Vanity; Profit is Sanity; Cash Flow is Reality.
Because the first two are a mix of cash and accruals, they can be highly misleading with many assumptions, estimates and judgement calls. For the same reason, your:
- Order book is irrelevant
- Revenue is irrelevant
- Gross margins are irrelevant
- Receivables are irrelevant
- EBITDA is irrelevant
- EBIT is irrelevant
- Net Profit is irrelevant
The tool that provides clarity about a
situation’s severity is the cash budget.
The alarm is the cash survival ratio, also known
as cash buffer
days. Cash survival ratio = Cash balance/ average daily cash
outflows from operations and is measured in no of days. It forecasts how many days
the business can survive without injecting new cash.
If this ratio has been heading down and is in
double digits it’s probably time to look urgently at cutting costs, collecting
receivables and look around for funds.
Liquidity
The most common measures of liquidity are the
current and quick ratios. A liquid asset is something you can quickly convert
into cash without loss of value. Inventories and receivables are far less
liquid in these troubled times.
But the current ratio is nonsense. It often overstates liquidity because the numerator has two items i.e. inventories (what you cannot sell) and debtors (what you can’t collect).
Instead, calculate the Cash Ratio (cash/current liabilities). This ratio is more conservative because it only considers the most liquid resource i.e. cash. Less than 1 is usually bad news. Less than 1 may NOT be bad news IF you’ve lengthier-than-normal credit with suppliers, well-managed inventory, and give little credit to customers.
Working capital
This is where most of the problems start.
Working Capital is defined as Current Assets –
Current Liabilities. Although common, it’s not great to have positive WC in
tough times; it means your funds are stuck in inventory and receivables. Receivables
and inventory rise faster than payables.
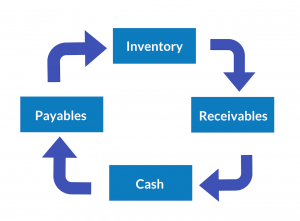
Which brings us to the crucial Cash Conversion Cycle (“Cycle”).

Take a trading company.
This Cycle shows how much time it takes (in days)
to convert raw materials bought on credit (inventory) to receivables to cash
which is used to pay suppliers.
Generally, the longer this cycle takes the less cash you will have. Because you must pay suppliers, payroll, rent, etc. irrespective of when and how much you sell and collect. In the case of manufacturing companies this cycle is even longer due to work in progress. And currently, this cycle is lengthening at a dramatic pace for many companies.
Ask what is causing the Cycle to rise. Inventory? Receivables? Calculate the Days inventory On Hand (DOH) and Days Sales Outstanding (DSO) to reveal the story.
Operating Leverage (“OL”)
Everyone knows about Financial Leverage (debt). But
few know of its close and equally dangerous but far more common cousin Mr. Operating
Leverage. This causes more harm these days than Financial Leverage.
OL comes from fixed operating costs; payroll, rent etc. It’s defined as the percentage change in Earnings Before Interest and Tax (“EBIT”) for a 1% change in sales. It shows how sensitive your operating profit is to change in sales.
High OL is excellent when sales are rising because mathematically once you cover your fixed costs all additional sales go straight to profits. It’s bad when sales fall, and disastrous when sales crater as in now.
Manufacturing, utility, airline and software companies
have high OL. Retailers and labor-intensive industries such as
restaurants have low OL.
Calculate your OL. What is the impact on your
profit of a 30/50/70% drop in revenue? Can you switch to a variable cost
structure? The more variable, the less the OL. Its easier said than done though.
What fixed costs can you cut? The less fixed costs, the lower the OL.
Solvency
This show how much debt you have, on a relative
basis.
How to measure? First, ignore EBITDA related
ratios. Focus on Debt ratios like Debt to Equity and Debt to Capital.
Another ratio is the Cash Flow to Debt Ratio which is the projected Cash Flow from Operations (“CFO”) divided by total debt. It tells you how fast debt can be paid off if you were to devote ALL your CFO for that. Normally, you want to see this ratio above 66% — the higher, the better. The higher the more flexibility you have. Some analysts use free cash flow instead of cash flow from operations.
Also, look at loan payments due in the next 3-6 months including operating lease payments (off balance sheet).
Use cash flow forecasting.
Financial Leverage (“FL”)
If OL is from fixed operating costs, FL is from
fixed financing costs i.e. interest on debt. FL is the % change in Net Income
for a 1% change in Earnings Before Interest and Tax (“EBIT”).
High FL is great when EBIT rising. It’s disastrous
when EBIT plummeting. High FL also happens when you have a high proportion of debt.
Calculate the FL. See the impact of a 30/50/70%
drop in EBIT on Net Income.
Predictive models
In these tough times, we
must assess the likelihood of bankruptcy and accounting fraud. The next two measures
help in this.
Detecting bankruptcy
The Altman Ratio has been
the default tool for decades.
You get the Z-score formula for predicting bankruptcy which is used to predict the probability that a firm will go into bankruptcy within two years.
Z Score = 1.2T1 + 1.4T2 + 3.3T3 + 0.6T4 + .999T5
Where:
- T1 = Working Capital / Total Assets (High =positive working capital)
- T2 = Retained Earnings / Total Assets (High =profitable + less debt financing)
- T3 = Earnings Before Interest and Taxes / Total Assets (High = high operating profits)
- T4 = Market Value of Equity / Total Liabilities (High = more investor confidence)
- T5 = Sales/ Total Assets (High= more sales efficiency)
Zones of Discrimination:
Z > 2.99 : “Safe”
Zones 1.81 < Z < 2.99 : “Grey”
ADVERTISEMENTZones < 1.81 : “Distress”
Detecting earnings
manipulation
The second predictive
model is the Beneish model. Because research shows a higher probability of fraud
during recessions.
You calculate the M score
as below.
M-score = –4.84 + 0.920 (DSRI) + 0.528 (GMI) + 0.404 (AQI) + 0.892 (SGI) + 0.115 (DEPI) – 0.172 (SGAI) + 4.67 (Accruals) – 0.327 (LEVI)
It’s a multiple regression model with eight independent
variables. Four of the eight are Lead indicators and four are Lag indicators as
explained below:
- Days’ Sales in Receivables Index (DSRI): Large increase in receivables
might suggest accelerated revenue recognition (lag) - Gross Margin Index (GMI): Margin deterioration creates an incentive to
inflate profits (lead) - Asset Quality Index (AQI): An increase in intangibles indicates wrong cost
deferral (lag) - Sales Growth Index (SGI): High sales growth companies are more likely to
commit fraud to keep sales up (lead) - Depreciation Index (DEPI): Falling depreciation rates suggests useful lives have
been stretched to inflate profits (lag) - Sales, General and Administrative Expenses (SGAI): Disproportionate increase may
be an incentive to inflate profits (lead) - Leverage Index (LVGI): Increase in leverage creates an incentive to
manipulate profits in order to meet debt covenants (lead) - Total Accruals to Total Assets (TATA): Higher accruals means high
chance that profits have been manipulated (lag)
It classifies a company as an earnings
manipulator if its M-Score is greater than -2.22.
Buy or sell?
I am an investor and follow the US stock market
closely. Of course, all the above are important to an investor who is keen on fundamental
analysis. Additionally, you’ve to look at valuations, a very tricky area these
days.
The Fair Value of a stock is what the price
SHOULD be. For a listed stock if the Fair Value (“FV”) exceeds Market Value
(“MV”) you normally BUY. If opposite, SELL.
For calculating the FV you need a price comparable (e.g. PE ratio) or cash flows, both of which come from forecasted company financials. The unusual issue now is that companies CANNOT give reliable estimates of either. Hence the estimation of FV is almost impossible. And please don’t use the fair values listed on report and websites; they are old and grossly overstated.
Let’s look at MV. After a sharp fall, the market rallied and has been range-bound for the last month. But many expect another fall, with a forecasted S&P of between 1,800 and 2,200.
Hence both FV & MV are unreliable and this is
a frustrating situation because you cannot really know how overvalued or undervalued
a stock is.
My advice? Since most FV’s are inflated, either wait
till you have more visibility on earnings. Or, in the absence of earnings guidance,
invest with a minimum 30% upside.
Conclusion
The above are indicators, not solutions. They enable you to you ask incisive questions and think of scenarios and solutions.
And number crunching is a complement to, not a substitute for, solid business sense.
(The author, Binod Shankar, is an entrepreneur, podcaster, and guest on CNBC Arabia. This article reflects the opinions of the writer alone and not necessarily that of AlphaStreet)
